Bitcoin Price Bottom Signals Emerge as Death Cross and Lunar Cycles Converge for November Reversal

In Brief
Bitcoin price faces death cross near $100,000 in mid-November as 50-day SMA crosses below 200-day SMA, pattern historically marking local bottoms rather than sustained downtrends.
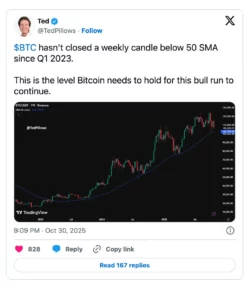
Critical 50-week SMA support at $102,800 has prevented weekly closes below since Q1 2023, serving as definitive bull market threshold that must hold.
Rising wedge formation on weekly charts suggests potential 15-35% correction based on 2018 and 2021 precedents, though broader ascending channel remains intact.
Lunar cycle analysis identifies October 29 First Quarter moon as potential rally catalyst, with historical patterns showing upward moves extending into Full or Third Quarter phases.
Consolidation between $105,000-$110,000 viewed as market testing holder patience rather than breakdown, with $170,000+ targets maintained by analysts citing intact bull structure.
Bitcoin price appears to be forming a local bottom as multiple technical indicators and unconventional analytical methods converge around mid-November timing for potential reversal. The anticipated death cross—where the 50-day simple moving average crosses below the 200-day SMA near $100,000—historically signals exhaustion bottoms rather than the beginning of prolonged declines, while the critical 50-week SMA support at $102,800 defines the boundary between continued bull market structure and potential trend deterioration.
Adding intrigue to traditional technical analysis, some traders are overlaying lunar phase patterns on price charts, identifying correlations between First Quarter moons and rally initiations that extend into subsequent lunar phases. While these diverse analytical approaches differ dramatically in methodology and scientific rigor, their temporal alignment around November creates a focal point for traders assessing accumulation opportunities.
Death Cross Near $100,000 Marks Potential Capitulation Point
The impending intersection of Bitcoin’s 50-day and 200-day simple moving averages—the pattern known as a death cross—is expected to occur in mid-November near the psychologically significant $100,000 level. Contrary to the ominous name and bearish reputation this technical signal carries in popular discourse, historical analysis reveals death crosses in Bitcoin often mark local bottoms where selling exhausts rather than initiating sustained downtrends.
According to Binance research analyzing previous Bitcoin death crosses, the average price change one month following this pattern is merely -3.2%—a modest decline that challenges narratives portraying the signal as reliable predictor of lasting bear markets. This statistical reality suggests death crosses function more as lagging confirmations of weakness that has already occurred rather than leading indicators forecasting future deterioration.
The timing of this death cross near $100,000 carries particular significance given the level’s psychological importance and its alignment with other technical support zones. Round numbers naturally attract disproportionate attention from market participants who anchor expectations and place orders around these thresholds, creating self-fulfilling support or resistance as orders concentrate.

Analyst Colin identifies approximately $98,000 as the lowest reasonable level for Bitcoin during the current bull market cycle, citing multiple support alignments converging in this region. This assessment incorporates both moving average confluence and prior consolidation areas that historically provide buying interest when tested.
The death cross mechanism itself reflects momentum dynamics rather than fundamental deterioration. When shorter-term moving averages fall below longer-term ones, it indicates recent price action has been weaker than the longer historical average—essentially a mathematical description of what markets already experienced rather than a prediction of future weakness. By the time the cross occurs, much of the selling that created the condition has already happened, often leaving capitulation rather than continuation as the more probable outcome.
50-Week SMA Defines Bull Market Survival Threshold
The 50-week simple moving average currently sits at approximately $102,800 and represents the most critical technical level determining whether Bitcoin’s bull market structure remains intact or faces potential invalidation. This moving average has provided consistent support since Q1 2023, with Bitcoin never closing a weekly candle below this threshold throughout the entire advance from bear market lows.
Analyst Ted Pillows emphasized this level’s importance in October analysis, noting the unbroken string of weekly closes above the 50-week SMA characterizes the bull run’s technical foundation. Moving averages derive significance partly from their mathematical properties but more importantly from market participants collectively recognizing and respecting them as decision points, creating self-reinforcing dynamics where the levels function as support precisely because traders believe they will.
Binance data from October 2025 places the 50-week SMA at approximately $101,700—slightly below the $102,800 figure cited by other analysts, though this modest variance likely reflects different data sources or calculation methodologies rather than material disagreement about the support zone’s location. Both estimates converge around the low $102,000s as the critical threshold.
A confirmed weekly close below this support would represent more than just technical breakdown—it would mark the first such occurrence since the bull market began, potentially triggering reassessment among traders who’ve used this level as their primary bull/bear demarcation line. Such breaks often cascade as stop losses trigger and discretionary traders exit positions based on violated support.
However, the proximity of the 50-week SMA to the anticipated death cross near $100,000 creates a relatively tight support zone rather than widely separated levels. This concentration means Bitcoin doesn’t need to hold precise levels but rather maintain support within a broader $98,000-$103,000 range where multiple technical factors converge. The clustering of support elements often creates stronger zones than isolated levels because buyers have multiple justifications for entering positions.
Rising Wedge Formation Suggests Correction Risk
Despite bullish moving average support, Bitcoin’s weekly chart displays a rising wedge pattern—a formation characterized by converging upward-sloping trendlines that typically resolves with downside breaks. This pattern reflects diminishing momentum as price makes higher highs within an increasingly narrow range, indicating buyers struggle to push substantially beyond previous peaks even as they prevent significant declines.
Historical precedent from previous Bitcoin cycles suggests rising wedge breaks have resulted in corrections ranging from 15% to 35%, with specific examples from 2018 and 2021 providing templates for potential downside magnitude. A 15% decline from current levels near $107,000 would target approximately $91,000, while a 35% correction would reach roughly $70,000—though the latter would break well below the 50-week SMA and likely invalidate bull market assumptions.
The pattern indicates waning buying pressure at progressively higher prices, suggesting participants become less willing to commit capital at elevated valuations even as they remain unwilling to aggressively sell. This dynamic creates the narrowing price range that defines the wedge structure, with each successive high meeting earlier resistance and each low finding slightly higher support.
Importantly, rising wedges require confirmation through breakdown below the lower trendline before treating them as actionable bearish signals. Wedge patterns that break upward—though statistically less common—invalidate the bearish thesis and often generate substantial rallies as traders positioned for breakdown scramble to reverse positions.
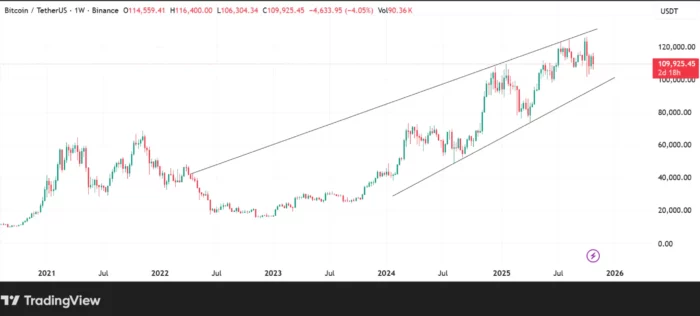
Ascending Channel Maintains Broader Bull Structure
Zooming out from the near-term rising wedge, Bitcoin’s longer-term chart structure shows a well-defined ascending channel established since 2022 that continues making higher lows and higher highs—the fundamental definition of an uptrend. This broader pattern provides context suggesting the wedge may represent consolidation within the larger bull move rather than terminal exhaustion.
Historical analysis of bounces from the ascending channel’s lower boundary shows rebounds ranging from 60% to 170% in previous instances, providing statistical basis for analysts maintaining price targets of $170,000 or higher. These projections assume the channel structure remains valid and that Bitcoin follows historical patterns where moves from support to resistance within established channels tend to be proportional.
The absence of traditional overbought cycle signals that typically appear at macro tops supports the view that the current consolidation represents mid-cycle digestion rather than cycle completion. Metrics including relative strength across timeframes, funding rates, open interest patterns, and on-chain profitability distributions haven’t reached extremes associated with major bull market peaks in 2013, 2017, or 2021.
Current sideways trading between $105,000 and $110,000 appears to be testing holder patience rather than marking structural breakdown, particularly affecting altcoin investors who’ve watched Bitcoin consolidate while alternative tokens struggle. This divergence between Bitcoin stability and altcoin weakness represents typical mid-cycle behavior rather than late-cycle distribution.
Colin’s analysis notes the current cycle has extended beyond standard Q4 peak timing that characterized previous bull markets, requiring adjustment to expectations about when the advance might culminate. He also observes Bitcoin broke precedent in the recent bear market by bottoming at $15,000—below the previous cycle’s $20,000 peak—marking the first time in Bitcoin’s history that a bear market low fell beneath the prior cycle’s high. This break from historical patterns suggests rigid adherence to past cycle timing may prove unreliable.
Lunar Cycle Analysis Identifies November Catalyst Timing
Beyond traditional technical analysis, some traders incorporate lunar phase patterns into their market timing frameworks, identifying statistical correlations between moon cycles and Bitcoin price movements throughout 2025. While lacking the scientific foundation and widespread acceptance of conventional technical tools, lunar analysis has gained a following among traders who observe recurring relationships between celestial timing and market psychology.
Analyst LP_NXT published analysis demonstrating that when Bitcoin price action is mapped alongside lunar phases, First Quarter moons—including the recent October 29, 2025 occurrence—have frequently coincided with the beginning of upward moves that extend into Full Moon or Third Quarter Moon periods. This observation suggests the late October First Quarter moon could mark the initiation of an advance lasting several weeks.
Proponents of lunar cycle analysis attribute observed correlations to recurring patterns in collective market psychology rather than direct celestial influence on markets. The theory suggests human behavior follows rhythms influenced by various environmental factors including lunar phases, with these behavioral patterns manifesting in market activity through the aggregated decisions of millions of participants.

Critics dismiss lunar analysis as pattern-seeking in noise—the human tendency to identify meaningful relationships in random data. The statistical significance of observed correlations remains debated, with skeptics noting that sufficient historical data allows finding apparent patterns with any variable if one searches long enough. The lack of causal mechanism explaining why lunar phases would influence cryptocurrency prices strengthens skepticism.
However, the practical question for traders isn’t whether lunar analysis possesses scientific validity but whether it provides actionable timing information regardless of underlying mechanism. If sufficient market participants believe in and trade based on lunar patterns, their collective behavior could create self-fulfilling prophecies where the patterns work precisely because people expect them to—similar to how technical analysis levels function as support and resistance through collective recognition.
The alignment of lunar timing suggesting late October/early November as an inflection point with technical analysis pointing to mid-November as potential bottom creates temporal convergence that some traders view as strengthening the probability of reversal. Whether this represents genuine analytical confluence or coincidental timing remains debatable, but the overlap focuses attention on November as a critical period.
Market Psychology Suggests Patience Required
Current market conditions reflect tension between short-term technical weakness and longer-term bullish structure, creating environment where holder conviction faces testing through extended consolidation. Colin’s analysis emphasizes the importance of patience, suggesting the cycle’s extension beyond traditional Q4 peak timing functions as a shakeout mechanism that exhausts participants expecting conventional patterns.
He recommends maintaining Bitcoin positions until new all-time highs are achieved, then potentially rotating into altcoins using Bitcoin-denominated gains several weeks after the peak—a strategy based on historical patterns where altcoins lag Bitcoin’s initial advance before outperforming during later cycle stages.
The psychological aspect of prolonged consolidation shouldn’t be underestimated. Markets that grind sideways for extended periods often achieve more thorough capitulation among weak hands than sharp corrections, as the slow erosion of hope and boredom prove more effective at forcing exits than sudden declines that can be rationalized as temporary volatility.
The death cross, while carrying bearish connotations, has historically functioned as capitulation signal rather than predictive indicator in Bitcoin markets. Educational materials from cryptocurrency custody provider Ledger note that death crosses often mark points where exhausted selling creates conditions for reversal rather than forecasting additional declines in advance.
Critical Week Ahead as Support Tests Conclude
As October 2025 concludes, Bitcoin’s immediate trajectory depends critically on whether weekly closes can maintain above the 50-week SMA near $102,800. This level represents not just technical support but the psychological threshold separating continued bull market structure from potential trend deterioration that would require reassessment of medium-term outlook.
The mid-November window identified by both moving average analysis projecting the death cross timing and lunar cycle analysis pointing to First Quarter moon catalysts provides traders with a specific timeframe for potential accumulation opportunities. This temporal convergence—regardless of whether one credits lunar analysis—creates focal point where multiple analytical approaches suggest watching for reversal signals.
Several scenarios could unfold from current positioning. Bitcoin might consolidate between $102,000-$110,000 through November, slowly building energy for eventual breakout without violating critical support. Alternatively, a brief spike below the 50-week SMA that quickly recovers could serve as capitulation event that shakes out remaining weak hands before sustainable advance. Or a confirmed weekly close below $102,000 could trigger the 15-35% correction that rising wedge pattern suggests as possibility.
For traders and investors, the setup demands clear risk parameters. Those viewing $98,000-$103,000 as high-probability support zone might use breaks below this range as stops, accepting the defined risk in exchange for positioning ahead of potential advance to $170,000+ if bull structure holds. Conservative approaches might wait for confirmation through reclaiming $110,000+ before entering, sacrificing early entry in exchange for greater confidence in reversal completion.
Diverse Analytical Methods Converge on November
The convergence of traditional technical analysis, moving average dynamics, chart pattern recognition, and unconventional lunar cycle timing around November 2025 creates an unusual situation where dramatically different analytical methodologies arrive at similar temporal conclusions. Whether this represents genuine confluence providing high-probability setup or coincidental alignment of unrelated factors remains to be determined through price action.
What’s clear is that multiple support elements cluster in the $98,000-$103,000 range, multiple timing frameworks point to mid-November as potential inflection point, and Bitcoin’s broader bull market structure remains intact absent weekly closes below key moving averages. These factors combine to make November 2025 a decisive period for Bitcoin’s near-term trajectory and potentially for the continuation of the bull cycle that began from 2022 lows.
For participants navigating these conditions, the diversity of analytical approaches employed across the trader community—from rigorous technical analysis to speculative lunar timing—highlights the challenge of finding edge in markets where information and tools are widely distributed. Success may depend less on discovering unique analytical methods than on maintaining discipline during consolidation periods that test conviction, managing risk appropriately when positioned, and recognizing inflection points when they arrive regardless of which analytical framework predicted them.
The next several weeks will reveal whether the death cross near $100,000 marks capitulation bottom as historical precedent suggests, whether the 50-week SMA continues its unbroken support streak since Q1 2023, and whether lunar cycles provide any genuine timing value or simply represent another form of pattern-seeking that markets sometimes honor through self-fulfilling dynamics. November 2025’s price action will offer answers to these questions while potentially setting the trajectory for the remainder of the bull cycle.
Missed buying crypto at the market bottom?
No worries, there's a chance to win in crypto casinos! Practice for free and win cryptocurrency in recommended casinos! Our website wheretospin.com offers not only the best casino reviews but also the opportunity to win big amounts in exciting games.
Join now and start your journey to financial freedom with WhereToSpin!
Middle East
wheretospininkuwait.com provides a comprehensive selection of trusted online casino reviews for the Middle East أفضل كازينو على الإنترنت. The platform features well-established casinos supporting crypto deposits in the region, including Dream Bet, Haz Casino, Emirbet, YYY Casino, and Casinia.
South Africa and New Zealand
In the South African online casino market, wheretospin.co.za highlights top-rated platforms and online casinos such as True Fortune Casino and DuckyLuck. Meanwhile, for New Zealand players, wheretospin.nz showcases highly recommended casinos, including Casinia, Rooster.bet, and Joo Casino.