In Brief
Ethereum price shows renewed rally potential with whale wallets accumulating 150,000 ETH worth $588 million over 24 hours.
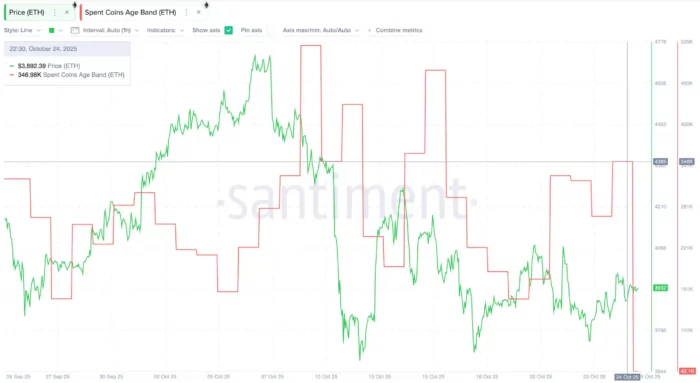
Spent Coins Age Band collapsed 88% from 346,000 ETH to 42,100 ETH, indicating holders are staying put rather than distributing.
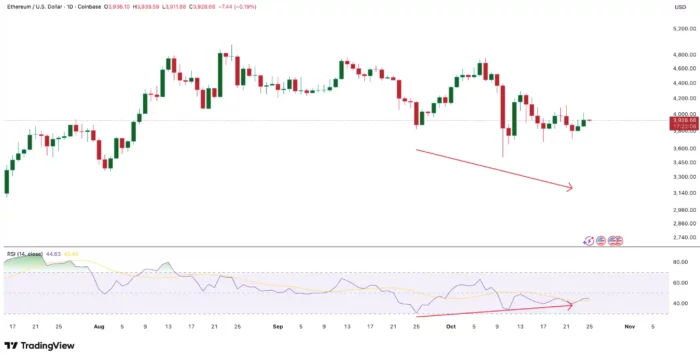
RSI bullish divergence persists with higher momentum lows against lower price lows between September 25 and October 22.
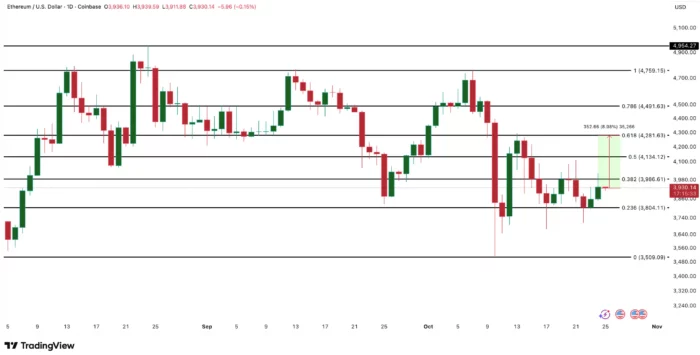
Critical Fibonacci resistance levels at $3,986 and $4,281 have rejected multiple rally attempts including October 10 and 17 bounces.
Decisive close above $4,281 would confirm reversal structure and project targets toward $4,491-$4,954 range.

Ethereum price is building what appears to be its most convincing rally setup in weeks, as whale accumulation accelerates while coin movement plummets to levels typically associated with strong holder conviction. Trading with a modest 2.1% gain over seven days after sliding 1.9% across the past month, ETH finds itself at a technical inflection point where on-chain behavior suggests accumulation while chart structure awaits confirmation.
The convergence of declining coin circulation and aggressive large-holder buying creates conditions that historically precede sustained upside moves, yet Ethereum must still overcome resistance levels that have repeatedly capped previous bounce attempts.
Dormancy Surges as Coin Movement Collapses
The Spent Coins Age Band metric reveals a dramatic shift in holder behavior, with ETH movement across wallets of all age cohorts declining 88% from 346,000 ETH on October 22 to just 42,100 ETH by October 25. This three-day collapse in coin circulation represents one of the sharpest drops in wallet activity this quarter.
This metric tracks the total volume of Ethereum moving between addresses regardless of how long those coins have been held. When the figure drops precipitously, it indicates holders across the entire age spectrum—from day traders to multi-year accumulators—are choosing retention over distribution. Coins that stop moving effectively become dormant, removing supply from active circulation and creating conditions where even modest buying pressure can move prices substantially.
The current decline is particularly significant because it encompasses both short-term and long-term holder cohorts simultaneously. When only long-term holders stop selling, it might indicate conviction but lacks the broader market support needed for rallies. When both groups cease distribution together, it suggests a market-wide shift toward accumulation positioning rather than isolated behavior among specific cohorts.
Rising dormancy typically precedes price appreciation because it reflects growing conviction that current levels represent value worth holding rather than liquidating. Holders who could sell but choose not to effectively vote with their wallets that they expect higher prices ahead. This collective decision to hold removes overhead supply that would cap rallies, creating the structural conditions necessary for sustained upward moves.
The 88% decline in movement over just three days suggests this isn’t gradual accumulation but rather a sharp transition in market psychology—from distribution or uncertainty to conviction and patience.
Whale Wallets Deploy Nearly $600 Million
While smaller holders have stopped selling, the largest Ethereum wallets have shifted to aggressive accumulation mode. Addresses holding more than 10,000 ETH—a threshold that captures institutional players, funds, and high-net-worth individuals—increased their combined holdings from 100.41 million to 100.56 million ETH over the past 24 hours.
This 150,000 ETH addition represents approximately $588 million in capital deployment at current prices, marking one of the largest single-day whale accumulation events since mid-September. The magnitude of this buying becomes clearer when examining the velocity: these wallets absorbed nearly $25 million per hour during this accumulation window.
Whale buying carries different implications than retail accumulation. These entities typically operate with longer time horizons, deeper research capabilities, and higher conviction thresholds before deploying substantial capital. Their willingness to add significant positions suggests they’ve identified value others are missing or possess information about upcoming developments that aren’t yet public.
The timing of whale accumulation relative to dormancy increases creates particularly bullish confluence. When large wallets buy while existing holders refuse to sell, it removes the natural equilibrium where aggressive buyers would normally trigger profit-taking from patient holders. Instead, buyers must chase prices higher to find willing sellers, creating the momentum necessary for sustained rallies.
Historical pattern analysis shows that periods combining rising dormancy with whale accumulation typically resolve upward within days to weeks rather than months. The dual signal indicates both conviction among existing holders and fresh capital deployment from sophisticated players—a combination that rarely persists without directional resolution.
RSI Divergence Signals Weakening Downside Momentum
Technical analysis through the Relative Strength Index reveals that Ethereum’s recent weakness may be losing strength despite price remaining under pressure. Between September 25 and October 22, ETH established a pattern of lower lows on the price chart while RSI simultaneously formed higher lows across the same timeframe.
This bullish divergence indicates that each successive price decline is accompanied by less aggressive selling momentum than the previous one. The pattern suggests bears are exhausting their ability to push prices lower even though they maintain short-term control. Divergences of this type frequently appear at trend transitions, marking the phase where downtrends lose conviction before reversals materialize.
The current divergence isn’t isolated to a single occurrence. Similar patterns emerged on October 10 and October 17, both generating short-lived bounces that failed to sustain. However, those earlier divergences lacked the supporting on-chain evidence now present—specifically the combination of collapsing coin movement and aggressive whale accumulation.
The repeated divergence failures highlight an important distinction: technical signals alone rarely generate sustained moves without fundamental or behavioral support. Previous bounces fizzled because they reflected temporary oversold conditions rather than genuine shifts in market structure. The current setup differs in that chart signals align with observable changes in holder behavior and capital flows.
RSI divergences become particularly reliable when they persist across multiple weeks rather than appearing as brief anomalies. The pattern stretching from late September through late October demonstrates sustained weakening in selling pressure rather than momentary exhaustion, increasing the probability that eventual resolution breaks upward rather than continuing the downtrend.
Fibonacci Resistance Defines Path Forward
Despite improving fundamentals and technical signals, Ethereum faces immediate resistance at Fibonacci retracement levels that have consistently rejected rally attempts. The 0.382 level at $3,986 and the more significant 0.618 level at $4,281 have each turned back multiple bounce attempts, including those on October 10 and October 17.
These Fibonacci levels derive from the decline that began at Ethereum’s recent highs, representing mathematically significant retracement zones where profit-taking and short entries typically concentrate. The 0.618 level—often called the “golden ratio”—carries particular importance because it frequently separates corrective bounces from genuine trend reversals.
The October 10 and 17 rallies both stalled at or just below these resistance zones, creating overhead supply from traders who bought those bounces and now sit underwater. These positions represent potential sellers who will look to exit near breakeven, adding resistance that must be absorbed before Ethereum can push higher.
A daily close above $4,281 would accomplish several critical objectives. First, it would validate the bullish divergence pattern and confirm that technical signals are converting to price action. Second, it would clear overhead resistance from failed bounce attempts, removing a significant supply overhang. Third, it would represent approximately 9% upside from current levels—a move substantial enough to trigger momentum-based buying from technical traders.
Breakout confirmation above $4,281 would project initial targets toward $4,491 based on the pattern’s structure, with extended moves potentially reaching $4,954 if momentum accelerates. These levels align with previous support zones that would likely function as initial resistance on any sustained rally.
Downside Risk Parameters Remain Defined
The bullish setup remains contingent on Ethereum maintaining support at $3,804, which represents the most recent consolidation low and functions as the structure’s invalidation level. Sustained trading below this threshold would call into question whether the current setup represents genuine accumulation or merely another failed bounce attempt.
A breakdown below $3,804 would likely trigger defensive selling from those positioned for the bullish scenario, potentially accelerating declines toward $3,509 where the next significant support cluster exists. This level represents approximately 10% downside from current prices, establishing relatively balanced risk-reward parameters for those entering positions.
The current setup offers roughly 1:1 risk-reward to initial targets at $4,281, improving to approximately 2:1 if extended targets at $4,954 materialize. This ratio becomes more favorable for bulls if entry positions can be established closer to support at $3,804.
What Makes This Setup Different
Previous Ethereum bounce attempts in October shared some characteristics with the current setup—RSI divergences, technical oversold conditions, brief periods of whale buying. Yet those rallies failed to sustain because they lacked the comprehensive behavioral shift now evident across multiple metrics.
The critical difference lies in the confluence of signals. Rising dormancy shows holders refuse to sell. Whale accumulation demonstrates sophisticated players see value. RSI divergence indicates technical exhaustion of selling pressure. Each element alone provides limited conviction, but their simultaneous alignment creates a more robust foundation.
Additionally, the current dormancy collapse happened over just three days rather than gradually building across weeks. This sharp transition suggests a discrete event or psychological shift rather than slow accumulation, typically leading to more explosive resolutions once price confirms the behavioral change.
The whale accumulation magnitude also exceeds previous buying episodes. While large holders added positions during earlier October bounces, the $588 million deployed over 24 hours represents substantially higher conviction and capital commitment than previous accumulation windows.
Catalysts That Could Trigger Breakout
Several potential catalysts could provide the spark that converts technical setup to sustained rally. Month-end portfolio rebalancing flows typically create directional moves as institutional players adjust allocations. Any developments around Ethereum network upgrades or layer-two scaling solutions could reignite fundamental interest.
Broader crypto market strength, particularly if Bitcoin breaks above its own resistance levels, would likely lift Ethereum through correlation effects. Conversely, renewed risk-off sentiment in traditional markets or unexpected regulatory developments could delay breakout timing regardless of technical setup quality.
The setup doesn’t guarantee immediate resolution but rather establishes conditions where catalysts can generate outsized moves. Markets in tight consolidation with declining volume and rising dormancy tend to release that energy explosively once direction becomes clear.
What Traders Should Monitor
The next several trading sessions will determine whether this setup converts to sustained rally or requires additional consolidation. Three specific developments warrant close attention.
First, watch whether coin movement remains suppressed below 50,000 ETH on the Spent Coins Age Band. Sustained low circulation would confirm holders maintain conviction rather than the dormancy representing temporary pause before distribution resumes.
Second, monitor whether whale wallets continue accumulating or pause buying activity. Sustained large-holder accumulation would validate that sophisticated players maintain bullish conviction, while declining inflows might signal those entities have filled desired positions.
Third, observe whether Ethereum can reclaim $3,900 and hold it as support. This mid-range level represents the first step toward challenging the critical $4,281 resistance and would demonstrate strengthening buyer conviction.
For now, Ethereum price sits at a critical juncture where on-chain behavior, technical patterns, and market structure all suggest upside potential exists, yet immediate resistance at well-defined levels represents the final hurdle before that potential materializes into sustained gains. The groundwork appears stronger than previous bounce attempts, but confirmation through price action remains essential before declaring the rally has begun.