In Brief
Bitcoin price faces rejection at $112,000 resistance with RSI at 46 indicating insufficient momentum, threatening breakdown below ascending trendline toward $106,234 or $100,718 support.
Gold consolidation above $4,000 shows weakness as US-China trade tensions ease, with fading RSI momentum and position below 50 suggesting potential drop below $3,971 confirmation level.
Silver RSI approaches bearish crossover below signal line—pattern historically preceding price declines—targeting $47.41 initially with worst-case scenario at $45.51 representing 7% downside.
US-China truce resolves uncertainty that drove safe-haven flows into Bitcoin, gold, and silver, potentially triggering capital rotation away from defensive assets as risk appetite improves.
Government shutdown end could catalyze Bitcoin outperformance according to analysts, while precious metals face support from key moving averages at $48.16 and $47.73 for silver.

Bitcoin price, gold, and silver are displaying technical weakness suggesting potential breakdowns despite recent bullish positioning, as the resolution of US-China trade tensions removes a key driver of safe-haven demand that propelled these assets during periods of geopolitical uncertainty. The easing of market fear that accompanied trade war escalation creates conditions where capital may rotate away from defensive assets toward risk-on investments as confidence in economic stability improves.
Technical indicators across all three assets reveal fading momentum, tested support levels, and bearish divergences that historically precede corrections, creating a coordinated setup where Bitcoin, gold, and silver face similar downside pressures despite operating in different markets with distinct fundamental drivers.
Bitcoin Faces Rejection at $112,000 Amid Momentum Weakness
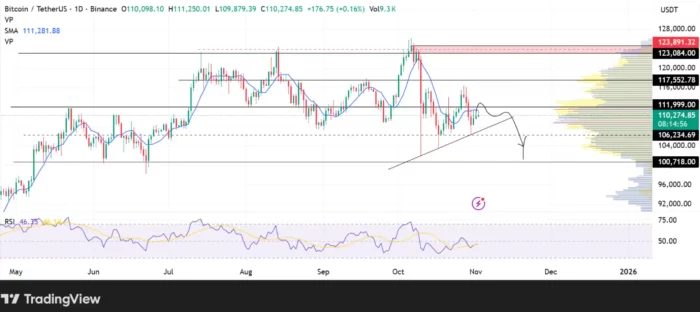
Bitcoin price has been consolidating along an ascending trendline throughout October, establishing a pattern of higher lows that typically characterizes healthy uptrends. However, the cryptocurrency has repeatedly failed to break decisively above $112,000, creating a resistance level where sellers consistently emerge to cap rally attempts. This resistance zone has been tested multiple times without clean breakout, accumulating overhead supply from traders who bought expecting continuation but now hold positions that moved against them.
The volume profile analysis showing yellow horizontal bars—representing areas of concentrated bearish activity—positioned just above $112,000 confirms this level functions as significant supply zone where selling interest increases substantially. When price approaches these high-volume resistance areas, the increased selling pressure typically forces reversals unless buying momentum proves exceptionally strong.
The Relative Strength Index reading of 46 indicates neutral to slightly bearish momentum that falls short of levels typically required for successful resistance breakouts. RSI values above 50 suggest bullish momentum dominates, while readings below 50 indicate bears maintain control. The current 46 reading places Bitcoin in a zone where neither bulls nor bears demonstrate clear dominance, yet the slight bearish tilt combined with proximity to resistance suggests the path of least resistance points downward rather than breakthrough.
Moving Average Pressure Creates Downside Bias
The 9-day Simple Moving Average positioned at $111,281—above current Bitcoin price—creates additional technical headwind that reinforces bearish bias. When price trades below short-term moving averages, it indicates recent average transaction prices exceed current market prices, suggesting sellers accepted lower prices and downward momentum persists.
This positioning creates a dynamic where rally attempts encounter selling pressure as price approaches the moving average. Traders who bought near the average and now hold losing positions look to exit near breakeven, creating supply that caps bounces. Additionally, momentum traders use moving average crosses as signals, with price below the moving average triggering sell signals or preventing new buy entries.
The technical mechanics suggest each rally attempt toward the 9-day SMA will face increased selling pressure as it approaches $111,281, making sustained moves above this level—and subsequently above the $112,000 resistance—increasingly difficult without substantial catalyst or dramatic shift in buying interest.
Downside Targets if Trendline Breaks
If Bitcoin breaks below the ascending trendline that has provided support throughout October’s consolidation, technical analysis projects initial downside targets toward $106,234—representing approximately 5% decline from current levels. This support level aligns with previous consolidation zones from the autumn advance that typically function as buying interest areas during retracements.
In more severe scenarios where selling pressure accelerates and intermediate support fails, Bitcoin could decline all the way to $100,718—roughly 10% below current prices. This level represents psychologically significant round number support just above $100,000 that would likely attract substantial buying interest as traders view six-figure Bitcoin as important threshold worth defending.
The gap between current price and these downside targets reflects the ascending trendline’s steepness and the vertical distance price would need to fall before reaching previous consolidation zones. This structure means trendline breaks often trigger relatively rapid declines as stop losses cluster just below the trendline and momentum-based selling accelerates once the pattern fails.
Bullish Scenarios Require Strong Breakout
Despite current weakness, Bitcoin maintains potential for bullish resolution if buying pressure strengthens sufficiently to drive price through the $112,000 resistance. A clean break—ideally on elevated volume—followed by successful retest of this level as support would validate upside continuation and project targets toward $117,552 based on the consolidation range and pattern measurements.
In highly bullish scenarios where momentum accelerates following initial breakout, Bitcoin could extend gains toward $123,084, approaching the previous cycle high near $126,199. However, analyst commentary suggests only a decisive daily close above $123,891 would position Bitcoin to reclaim and potentially exceed its peak price.
Analyst Ted notes that “The next step should be BTC outperformance, but it could happen if the US government shutdown ends”—linking Bitcoin’s bullish potential to resolution of the extended government dysfunction that has created policy uncertainty. This observation suggests the technical setup might resolve differently depending on external catalysts related to government operations and regulatory clarity.
Gold Shows Rally Exhaustion Above $4,000
Gold’s recent rally—likely driven by uncertainty surrounding US-China trade tensions—appears to be exhausting as the resolution of trade disputes removes a primary catalyst for safe-haven flows into precious metals. The XAU breakout above a descending parallel channel that had contained price during previous consolidation may prove short-lived if the fundamental driver that propelled the advance has dissipated.
The RSI indicator displays fading momentum through progressively lower highs despite price maintaining elevated levels—a bearish divergence pattern where momentum weakens even as price holds near peaks. Additionally, the RSI’s position below 50 indicates bears have regained control of momentum dynamics, shifting the balance from the bullish dominance that characterized the rally phase.
These technical deteriorations suggest gold’s advance has lost the buying pressure necessary to sustain elevated prices, creating conditions where gravity reasserts itself and price declines toward more sustainable levels that better reflect easing geopolitical tensions and reduced safe-haven demand.
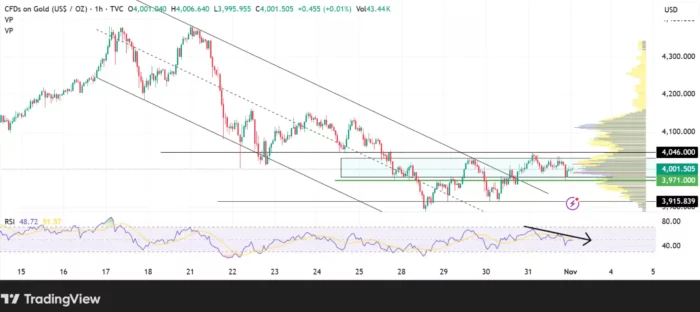
Breakdown Confirmation at $3,971
Technical analysis identifies $3,971 as the critical level on hourly timeframes where breakdown would be confirmed. A close below this threshold would validate that gold’s consolidation above $4,000 has failed and that the asset is transitioning from sideways trading to downtrend. This level likely represents the lower boundary of the consolidation range where previous support exists and where buyers attempted to defend elevated prices.
The emphasis on “break and close” rather than merely touching the level reflects the importance of confirmation in technical analysis. Brief dips below support that quickly recover often represent false breakdowns or stop-running rather than genuine trend changes. Sustained trading and closing below $3,971 would demonstrate sellers overwhelmed buyers decisively rather than temporarily.
Bulls Defend Current Levels
Despite bearish technical signals, volume profile analysis showing grey horizontal bars—representing areas of bullish volume concentration—at current levels indicates buyers are defending against further immediate downside. This buying interest creates tension between the technical signals suggesting weakness and the actual market behavior showing support at current prices.
If this defensive buying proves sufficient to exceed seller momentum, gold could break above its consolidation phase with confirmation requiring a one-hour candlestick close above $4,046. Such a move would invalidate the bearish breakdown scenario and suggest the consolidation represents continuation pattern within the larger uptrend rather than distribution before decline.
The battle between these competing forces—technical indicators suggesting weakness versus volume profile showing buying support—will likely resolve within coming sessions, determining whether gold extends its rally or corrects from recent gains.
Silver RSI Approaches Bearish Crossover
Silver faces its own technical deterioration as the RSI approaches a bearish crossover below its signal line—a pattern with strong historical precedent for preceding price declines. The RSI signal line represents a moving average of the RSI itself, and when RSI crosses below this average, it indicates momentum is not only weak but accelerating lower.
Historical analysis of previous instances when silver’s RSI executed similar bearish crossovers reveals consistent patterns where price declined in tandem with the technical signal. This historical reliability makes the impending crossover particularly concerning for silver bulls, as it suggests high probability that the pattern will again precede downward price movement.
Investors and traders monitoring this development appear to interpret RSI bearish crossovers as explicit sell signals, creating self-fulfilling dynamics where the technical pattern triggers actual selling that validates the signal. When sufficient market participants trade based on the same technical indicators, those indicators become reliable precisely because collective behavior creates the anticipated outcomes.

Downside Targets at $47.41 and $45.51
If the bearish RSI crossover confirms and triggers anticipated selling, technical analysis projects initial downside target at $47.41—a level identified by the 78.6% Fibonacci retracement. Fibonacci retracement levels represent mathematical ratios derived from the Fibonacci sequence that traders use to identify potential support and resistance zones during corrections.
The 78.6% retracement level indicates price would retrace 78.6% of the recent advance, representing substantial but not complete give-back of gains. This level typically attracts buying interest from traders viewing the retracement as healthy correction within ongoing uptrend rather than trend reversal.
In worst-case scenarios where selling pressure intensifies and initial support fails to hold, silver could spiral all the way to $45.51—representing nearly 7% decline from current levels. This downside target would constitute significant correction that tests whether silver’s longer-term uptrend remains intact or whether more substantial reversal is developing.
Moving Average Support Provides Defense
Despite bearish RSI signals, silver benefits from significant support provided by key moving averages positioned below current price. The 50-day SMA at $48.16 and 200-day SMA at $47.73 represent critical technical levels where substantial buying interest typically emerges during corrections.
These moving averages—particularly the widely-watched 200-day SMA—function as important support because they represent average prices over extended periods that many market participants use as value reference points. When price approaches these levels, buyers who missed earlier opportunities or who specifically wait for moving average tests often enter positions, creating the buying pressure that generates bounces.
If silver declines to these moving average support levels and buying pressure materializes as anticipated, the resulting bounce could catalyze renewed uptrend that provides “refreshing point for the bulls”—creating conditions where the correction completes and upside momentum can rebuild from more sustainable technical foundation.
Upside Scenario Requires 61.8% Fibonacci Reclaim
For silver to invalidate the bearish setup and resume uptrend, it would need to flip the 61.8% Fibonacci retracement level back into support through sustained trading above this threshold. The 61.8% level—often called the “golden ratio”—represents the most significant Fibonacci retracement and typically separates corrections from reversals.
Successfully reclaiming this level as support would project upside targets toward the confluence of resistance between the 50% Fibonacci retracement and 100-day SMA at $49.90. This zone represents approximately 3% upside from current levels and would mark silver’s successful navigation of the correction phase.
Extended upside beyond this confluence could target the 38.2% Fibonacci retracement at $51.01—representing roughly 5% gains from current prices. Reaching this level would indicate silver has largely reversed its correction and is positioned to potentially challenge recent highs if momentum continues building.
US-China Truce Removes Safe-Haven Catalyst
The resolution of US-China trade tensions through truce agreement removes a primary driver that propelled safe-haven assets including Bitcoin, gold, and silver during periods of heightened geopolitical uncertainty. Trade war escalation creates conditions where investors rotate capital toward defensive assets viewed as stores of value during instability, while trade agreements and reduced tensions typically trigger opposite flows as risk appetite improves.
This dynamic explains why all three assets face similar technical weakness simultaneously despite operating in different markets with distinct fundamental characteristics. The common thread connecting Bitcoin’s cryptocurrency market, gold’s precious metals trading, and silver’s industrial and monetary dual nature is their shared status as alternative assets that benefit from uncertainty and suffer when confidence improves.
The capital rotation hypothesis suggests that as US-China tensions ease and economic outlook stabilizes, investors will shift allocations away from defensive safe-haven positions toward risk assets including equities, corporate bonds, and growth-oriented investments that offer higher return potential in stable environments. This rotation creates selling pressure across defensive assets regardless of their individual technical or fundamental conditions.
Government Shutdown Impact on Bitcoin Outlook
The extended US government shutdown mentioned by analyst Ted as a factor constraining Bitcoin’s potential outperformance highlights how political dysfunction creates uncertainty that weighs on risk assets despite Bitcoin’s independence from government control. While Bitcoin protocol operates regardless of government operations, the regulatory environment, policy clarity, and institutional confidence that drive adoption all depend on functioning government.
The suggestion that shutdown resolution “could” catalyze Bitcoin outperformance acknowledges this connection between political stability and cryptocurrency market sentiment. When government functions normally and policy direction appears clear, institutional participants feel more comfortable maintaining or expanding cryptocurrency exposure. During shutdowns and political chaos, uncertainty premium increases and caution prevails.
This framing positions Bitcoin’s near-term trajectory as dependent partly on factors beyond cryptocurrency-specific developments—linking its performance to broader political and economic stability that influences overall market risk appetite.
Coordinated Weakness Across Defensive Assets
The simultaneous technical deterioration across Bitcoin, gold, and silver—three assets with limited fundamental correlation—suggests the weakness stems from common factor affecting all defensive positions rather than idiosyncratic developments specific to each market. The US-China truce provides plausible explanation for this coordination, as reduced geopolitical tensions should logically reduce safe-haven demand across all alternative assets.
This coordination creates conditions where weakness in one market may reinforce or lead weakness in others as traders recognize the common theme and adjust positioning accordingly. If gold breaks down confirming the safe-haven unwind thesis, Bitcoin and silver traders might preemptively reduce exposure anticipating similar dynamics will affect their markets.
Conversely, if one asset demonstrates resilience or reverses higher despite the bearish setup, it might provide confidence that the safe-haven unwind thesis is overstated and that individual asset fundamentals can overcome the macro headwind from easing tensions.
What to Monitor in Coming Sessions
Several developments will clarify whether these coordinated bearish setups across Bitcoin, gold, and silver materialize into actual breakdowns or whether the assets can stabilize and reverse despite technical warnings. For Bitcoin, watch whether price can reclaim the 9-day SMA at $111,281 and hold it as support, which would shift near-term bias back toward neutral or bullish.
For gold, the $3,971 level represents the critical threshold where breakdown would confirm on hourly timeframes. Clean break and close below this level would validate bearish thesis, while continued defense would suggest bulls retain control despite weakening momentum indicators.
For silver, the actual RSI crossover below its signal line will provide concrete sell signal that traders are watching. The speed and magnitude of any decline following this crossover will indicate whether historical pattern reliability continues or whether current conditions prove different.
Broader market factors including developments in US-China relations, government shutdown resolution, and general risk appetite across financial markets will influence whether the capital rotation away from safe havens accelerates or whether other factors emerge to support defensive asset positioning despite easing geopolitical tensions.
The next week will likely determine whether the coordinated technical weakness across these three defensive assets converts to actual breakdowns and substantial corrections, or whether the setups represent temporary weakness within larger uptrends that can resume once consolidation completes.