Understanding crypto charts is essential for successful trading, providing insights for better entry and exit decisions. This guide introduces popular technical indicators used in analyzing Bitcoin and other cryptocurrencies.
How to Read and Understand Crypto Charts?
When it comes to analyzing the crypto market, there are two primary methods: technical analysis and fundamental analysis. This guide focuses on the technical aspect of chart analysis. While fundamental analysis considers various factors such as news, events, broader financial and economic impacts, and industry conditions, technical analysis primarily revolves around charts.
Fundamental analysis aims to determine an asset’s intrinsic value and relies on objective reasoning. In contrast, technical analysis seeks to identify patterns and trends within an asset. To understand how to read crypto charts effectively, it’s essential to learn technical analysis.
Trading is a popular way to profit from crypto assets, but it requires some technical knowledge. Cryptocurrency prices are highly volatile, and the trading environment can be more dynamic than that of forex or stocks. Therefore, it’s advisable to start with a simple approach before delving into serious trading.
Technical Analysis Explained
Unlike fundamental analysis, which considers broader market factors, technical analysis is solely concerned with chart patterns and trends. To read crypto charts effectively, you must grasp technical analysis.
Trading cryptocurrencies can be lucrative, but it requires some technical knowledge. Cryptocurrency prices are highly volatile, and the market moves swiftly. Start with the basics before diving into serious trading.
Understanding Technical Analysis
Technical analysis involves examining current market conditions to predict future movements. It relies on price charts to identify trends, support, and resistance levels, and momentum, aiding traders in making informed decisions.
The core premise is that prices follow trends, often adhering to established patterns influenced by market psychology. Traders tend to react similarly in similar situations. Unlike fundamental analysis, technical analysis doesn’t gauge a cryptocurrency’s intrinsic value. Instead, it employs mathematical indicators and chart patterns to forecast future price actions.
Crypto Market Sentiment: Bulls vs. Bears
Cryptocurrency markets move in three directions: up, down, or sideways. An upward-moving market is bullish, indicating rising asset prices due to increased buying activity. Conversely, a downward market is bearish, with falling prices due to increased selling. Sideways movement is considered range-bound or consolidating.
Understanding these trends is crucial for successful trading, as price direction is more likely to follow the current trend than to reverse it. Trends can persist for extended periods, with Bitcoin bull and bear markets lasting several years before reversing. Even within trends, there can be rallies, corrections, or pullbacks that seem like reversals but often lead to resuming the original trend.
Using Moving Averages
Moving averages, such as the simple moving average (SMA) and exponential moving average (EMA), are common technical indicators in crypto charts. They filter out short-term price fluctuations, providing lagging trend indicators.
Two popular moving averages for crypto charts are the 50-day and 200-day moving averages. When these lines intersect, it signals potential trend reversals:
- Golden Cross: Occurs when the 50-day moving average crosses above the 200-day moving average, indicating a bullish trend reversal.
- Death Cross: Occurs when the 50-day moving average crosses below the 200-day moving average, indicating a bearish trend reversal.
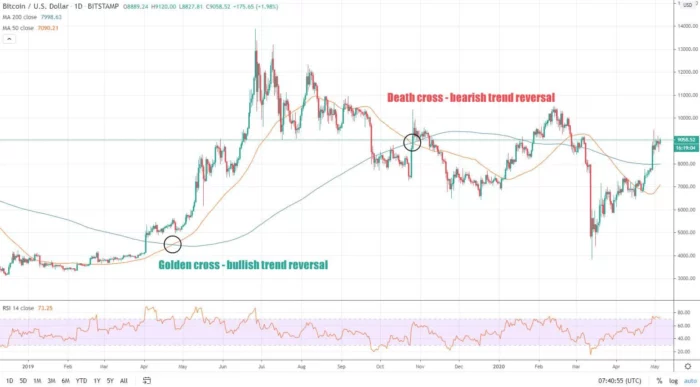
Moving averages on the BTC chart – Tradingview.com
These moving averages also serve as support and resistance zones.
Understanding Support and Resistance Levels
Support and resistance levels are fundamental concepts in interpreting crypto price charts and are among the most widely used indicators. These levels provide crucial insights into market dynamics.
Markets tend to fluctuate over time, and areas where prices pull back are referred to as resistance, while bounces from downward movements are termed support levels.
The strength of these levels evolves as prices interact with them. When prices repeatedly approach a level without breaking above it, the resistance at that point becomes stronger. Conversely, when prices frequently drop to a level but don’t breach it, the support at that level strengthens.
When prices move through these zones, it’s known as a breakout. Following a breakout, the next level of support or resistance becomes relevant, either above or below the breakout point.
Recognizing and identifying these support and resistance areas is essential for making well-informed trading decisions based on market trends.
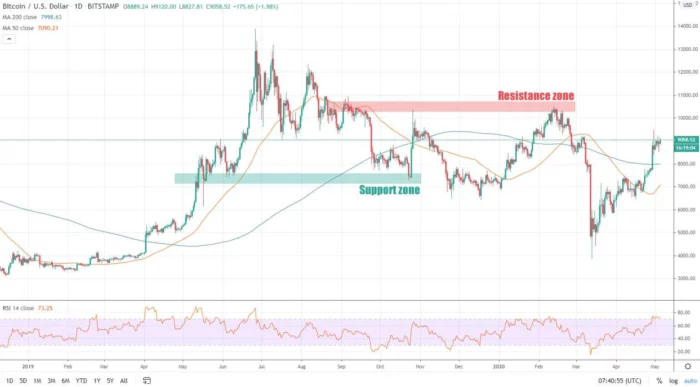
Support and resistance on BTC chart – Tradingview.com
Using Fibonacci Retracement
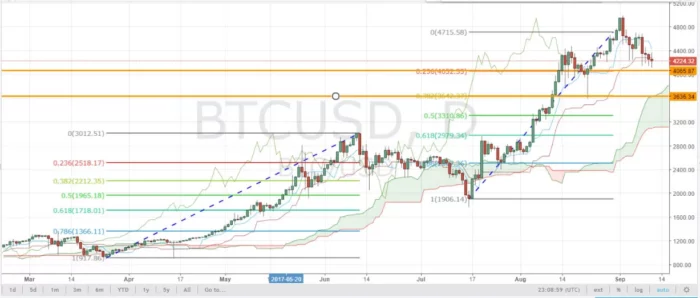
Fibonacci retracement levels on 2017 BTC chart – Investdiva.com
Fibonacci retracement levels are valuable tools for traders. These levels, based on the Fibonacci sequence, help identify potential retracement areas after significant price movements. Traders use them to predict support and resistance levels.
Other Technical Indicators
In addition to moving averages and Fibonacci levels, crypto charts can benefit from a range of other technical indicators for analysis. Let’s explore some of these key indicators:
1. RSI (Relative Strength Index): RSI is a valuable tool for assessing whether an asset is overbought or oversold, providing insights into market strength. It operates on a scale of 1 to 100. A reading below 30 indicates oversold conditions, while a reading above 70 suggests overbought conditions.
2. MACD (Moving Average Convergence Divergence): MACD is a favored choice among traders as it combines different moving averages to identify trends more precisely. It also incorporates a histogram that visualizes the difference between fast and slow-moving averages.
3. Stochastic Oscillator: This straightforward momentum oscillator helps predict ongoing trends by measuring price changes over closing periods. It can also signal whether a crypto asset is in an oversold or overbought state.
4. Parabolic SAR (Stop and Reversal): Parabolic SAR adds dots above or below candlesticks to highlight potential reversals in price movements and the conclusion of trends.
5. Bollinger Bands: These bands serve as a measure of market volatility. When prices move sideways, the bands contract, and during significant price movements, they expand. Notably, the upper and lower bands can also function as support and resistance levels.
While additional indicators such as Ichimoku Kinko Hyo (IKH), Average Directional Index (ADX), and the Chaikin Oscillator exist, they fall outside the scope of this introductory guide.
Furthermore, specific to Bitcoin, there are indicators like exchange volumes, liquidity, Hash Ribbons, Puell Multiple, Dynamic Range NVT Signal, Metcalfe’s law, UTXO metrics, and BTC Energy Value Oscillator. These, however, delve into on-chain metrics and advanced analysis.
Please feel free to reach out if you require further clarification or have any additional questions.
Candlestick Patterns
Understanding Japanese candlesticks on crypto charts is fundamental. Each candle represents price action within a specific timeframe and comprises two main elements: the solid body and extended wicks. These components are determined by the open, high, low, and close prices (OHLC):
– Open: This signifies the first trade made during the specified timeframe.
– High: It reflects the highest traded price.
– Low: This indicates the lowest traded price.
– Close: It represents the last trade executed within the specified timeframe.
To put it simply, candlesticks correspond to a designated timeframe, such as one hour. In this context, each candlestick’s body displays the opening and closing prices for that hour. Meanwhile, the upper and lower wicks show the highest and lowest prices observed during that hour.
Candlesticks can form various patterns and signals. When combined with the technical indicators discussed earlier, these patterns assist in gauging potential price directions. Refer to the infographic below for an overview of common candlestick patterns.
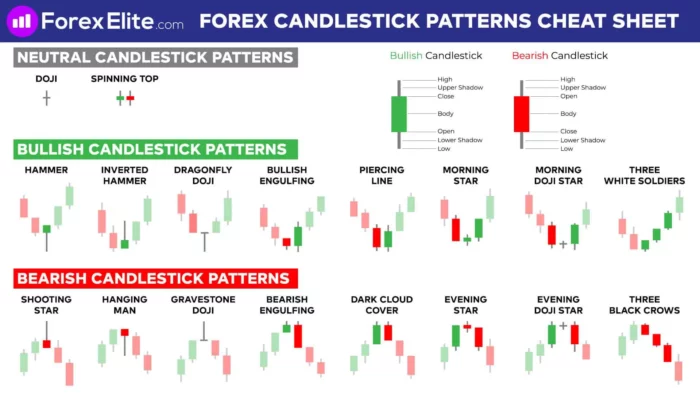
Common Japanese candle patterns – Forexelite.com
Time Frames in Crypto Chart Analysis
Understanding time frames is essential when analyzing crypto charts. A chart provides a snapshot of the market, but the choice of time frame significantly influences the signals from technical indicators. Hence, trading crypto effectively involves considering multiple time frames.
Popular charting software typically offers time frames ranging from 1 second to one month. The time frames you choose depend on your trading style:
– Scalpers, aiming for quick profits, prefer very short time frames, often one minute or less.
– Day traders may utilize 15-minute, one-hour, and four-hour charts.
– Long-term traders and hodlers focus on daily, weekly, and monthly charts.
Examining charts across different time frames offers a more comprehensive perspective on the overall trend, aligning with the adage,
“the trend is your friend.”
Crypto Chart Patterns
Patterns frequently manifest in crypto charts, offering insights into future price movements. These chart formations help identify trend reversals, continuations, as well as bullish or bearish momentum. Some commonly recognized chart patterns for Bitcoin and cryptocurrencies include:
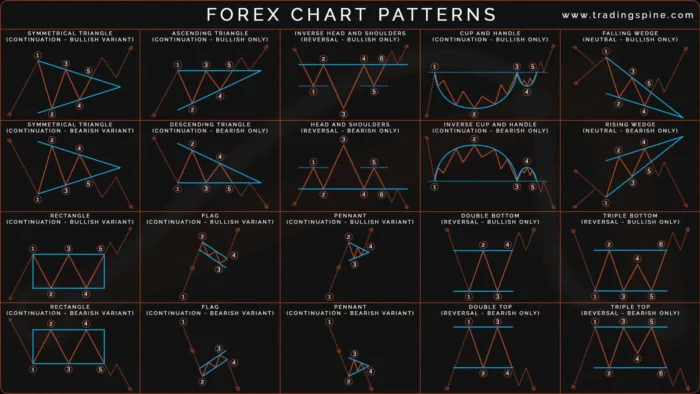
Common chart patterns – Tradingspine.com
1. Reversal Patterns: These include Head and Shoulders, Inverse Head & Shoulders, Cup and Handle, Double Top/Bottom, and Rising and Falling Wedges.
2. Continuation Patterns: They encompass Pennants, Rectangles, Flags, and Rising and Falling Wedges.
3. Bilateral Patterns: Symmetrical Triangles, Ascending or Descending Triangles. A bilateral pattern can lead to a price breakout in either direction.
Many of the chart patterns employed in forex trading are also applicable to crypto.
In addition to these patterns, traders can identify trend reversals or continuations through:
– Higher High, Higher Low: A bullish pattern indicating that prices are still rising, with uptrends intact. Prices surpass previous highs, and pullbacks are less severe.
– Lower High, Lower Low: A bearish pattern showing that prices are declining, with downtrends intact. Prices fail to surpass previous highs, and new lows form during pullbacks.
Chart patterns are crucial when trading Bitcoin and cryptocurrencies as they provide a broader perspective on the overall trend.
Divergences occur when there is a disparity between indicators and prices or chart patterns. In an uptrend, divergence happens when prices reach higher highs but indicators do not, while in a downtrend, it occurs when prices make lower lows but indicators do not. Detecting divergence increases the likelihood of a price retracement.
There are other crypto chart patterns like Elliott Waves, which follow the natural rhythm of market crowd psychology in waves. Additionally, there are fractals, recurring patterns often observed on Bitcoin charts. However, these topics go beyond the scope of this article.
Understanding Order Books and Market Depth in Crypto Trading
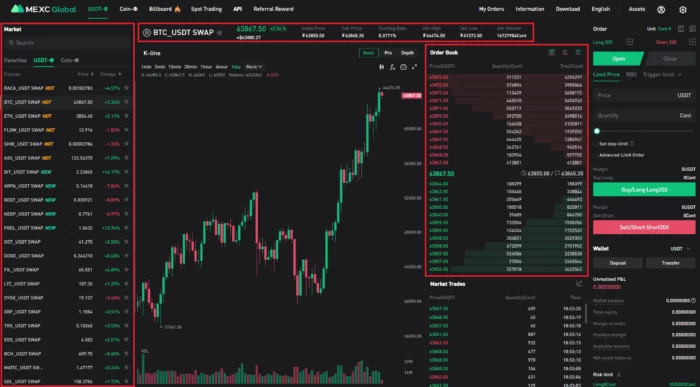
MEXC: mexc.com
An order book comprises active buy and sell orders, unique to each exchange. It categorizes orders into “bids” (green for buy orders) and “asks” (red for sell orders). “Bids” reflect the prices traders are willing to pay, while “Asks” (also known as “Offers”) are the prices at which traders are willing to sell.
Key points about order books:
– Each order in the book has a specified price and quantity.
– Orders are organized by price, assigning each unique price a row.
– The quantity (amount to buy or sell) at each price is combined within that row.
– The order book reveals market supply and demand by listing open orders by price and indicating their combined quantities.
Typically, the order book is structured with three columns: price, quantity, and total quantity. The market depth chart mirrors the order book, as its data is derived from it. Both sources convey the same information. In our example, the market depth chart appears as red and green horizontal bars behind the order book.
When seeking bid-ask spreads, buy and sell walls, or support and resistance levels, traders can opt for either the depth chart or the order book. Both are valuable tools for interpreting crypto charts and formulating well-informed trading strategies.
Conclusion
Reading crypto charts is a valuable skill for traders. While this guide provides an overview, practice and experience are essential. No single technical indicator works for every trading instrument, so traders must find what suits their strategy best.