Solana Price Struggles Below $200 as Exchange Inflows Crash to Six-Month Low Amid Weakening Confidence
In Brief
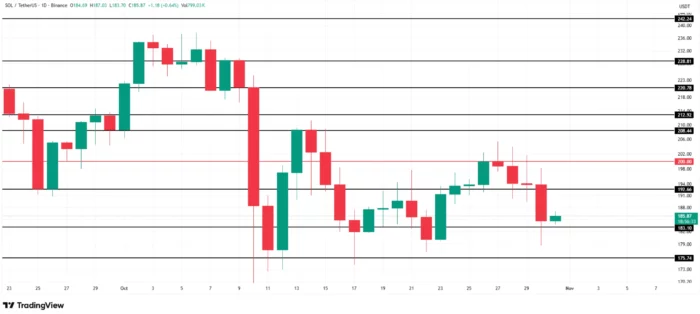
Solana price trades at $185 after failing multiple attempts to breach $200 resistance, triggering profit-taking and cautious positioning among holders.
Exchange net position data shows first notable outflows in three weeks, signaling shift from accumulation to distribution as confidence weakens.
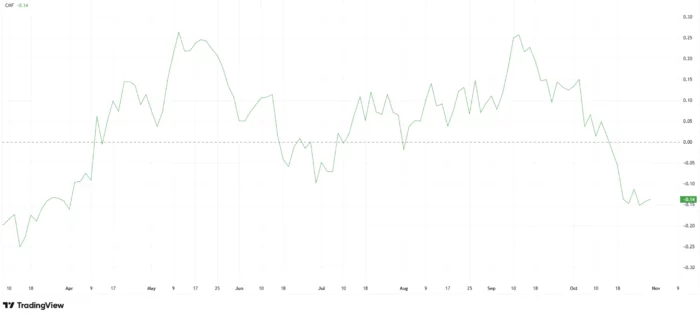
Chaikin Money Flow indicator hits six-month low reflecting heavy liquidity outflows that limit rebound potential and add pressure to resistance levels.
Critical $183 support level defines near-term structure, with breakdown potentially triggering decline toward $175 or extended weakness to $170.
Successful reclaim of $200 would invalidate bearish setup and project targets above $208, requiring renewed investor confidence and liquidity inflows.
Solana price is struggling to maintain momentum below the psychologically significant $200 level as exchange inflow data reveals a six-month low in capital entering the ecosystem, indicating fading investor confidence and growing distribution pressure among holders who accumulated during October’s advance. Trading at $185 after multiple failed breakout attempts above $200, SOL finds itself in a precarious technical position where weakening liquidity flows and emerging selling activity threaten the sustainability of its recent recovery trend.
The combination of deteriorating on-chain metrics and technical resistance creates conditions where Solana faces renewed downside risks unless capital inflows reverse or buying pressure strengthens sufficiently to overcome the $200 barrier that has repeatedly rejected rally attempts.
Exchange Data Reveals First Outflows in Three Weeks
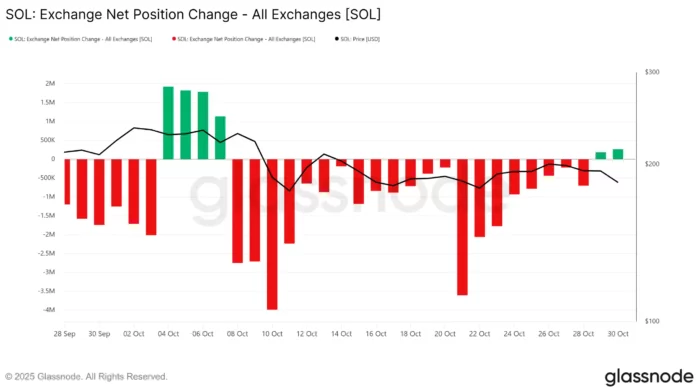
Exchange net position change metrics—which track the net flow of tokens moving onto or off exchanges—reveal the first significant outflows for Solana in three weeks, marking a behavioral shift among holders who had previously been accumulating or holding positions. This metric serves as a proxy for selling pressure because tokens moving onto exchanges typically precede sale activity, while tokens flowing off exchanges suggest accumulation for longer-term holding.
The emergence of net outflows coincides directly with Solana’s failure to breach the $200 resistance level, suggesting this technical rejection triggered profit-taking among holders who accumulated positions during the earlier advance. When strong resistance levels reject multiple breakout attempts, it often converts bullish positioned traders into sellers who realize gains rather than risk giving back profits during extended consolidation.
The timing is particularly notable because it marks the first sustained selling activity following a three-week period where exchange flows either showed accumulation or remained neutral. This transition from net holding or buying behavior to net selling indicates a regime change in market participant psychology—from expectation that prices will continue rising to concern that resistance might hold and prices could decline.
The magnitude of outflows, while representing the first notable movement in weeks, doesn’t yet indicate panic selling or capitulation-level distribution. Instead, it reflects measured profit-taking and position reduction among holders who view current levels as appropriate exits given the resistance encounter. However, if this selling activity accelerates or persists, it could evolve from controlled distribution into more aggressive liquidation that pushes prices substantially lower.
Exchange flows function as leading indicators because they capture behavioral intentions before those intentions manifest in price action. Holders deciding to move tokens onto exchanges for sale represent future selling pressure that hasn’t yet hit order books, making flow data valuable for anticipating near-term price direction. The current shift toward net exchange inflows suggests additional selling pressure may materialize even if it hasn’t fully impacted price yet.
Chaikin Money Flow Hits Six-Month Low
The Chaikin Money Flow indicator—which specifically measures the relationship between price and volume to identify whether accumulation or distribution dominates—has declined to a six-month low, providing confirmation that the exchange flow data represents genuine shift in market dynamics rather than temporary fluctuation. CMF readings below zero indicate distribution exceeds accumulation, with increasingly negative values suggesting intensifying selling pressure.
The six-month low designation carries particular significance because it indicates current distribution pressure exceeds any similar period since late April 2025. This context suggests the selling isn’t merely profit-taking from recent gains but potentially represents position liquidation from holders who accumulated months ago and now view current levels as appropriate exits despite the failed $200 breakout.
CMF’s decline reflects heavy liquidity outflows dominating the Solana market, limiting the asset’s capacity to rebound quickly from current levels. Rebounds require capital inflows willing to absorb selling pressure and push prices higher—when liquidity is actively leaving rather than entering, rallies face immediate selling that caps upside and creates the repeated resistance rejections Solana has experienced at $200.
The indicator’s trajectory matters as much as its absolute level. CMF declining from positive territory toward increasingly negative readings shows a trend toward distribution rather than a static condition. This momentum in the wrong direction suggests the selling pressure may continue intensifying unless some catalyst emerges to reverse the liquidity flow dynamic.
Persistent CMF weakness poses particular challenges for Solana’s technical structure. The failed breakout attempts at $200 already created overhead supply from traders who bought expecting continuation but now hold losing or break-even positions. Without fresh liquidity inflows to absorb this supply, any rally attempts face immediate selling that prevents clean breakouts—creating a self-reinforcing dynamic where failed breakouts trigger more selling, which causes more failed breakouts.
For CMF to recover and support bullish scenarios, Solana would need to attract renewed capital inflows that shift the accumulation/distribution balance. This typically requires either significant positive catalysts specific to Solana’s ecosystem, broader crypto market strength that lifts all assets, or prices declining to levels where value buyers emerge in sufficient force to overwhelm existing selling pressure.
Multiple Failed Breakouts Create Overhead Resistance
Solana’s inability to breach $200 after multiple attempts creates a technical scenario where this level accumulates sellers rather than breaking cleanly. Each failed breakout attempt leaves behind traders who bought expecting continuation but instead hold positions that moved against them. These holders represent latent supply—when price returns to their entry levels, many will exit to avoid losses or take small profits, creating resistance.
The $200 level carries dual significance as both a technical resistance level defined by recent price action and a psychological threshold given its round number status. Traders naturally anchor expectations around such levels, placing orders and making decisions based on these reference points. This collective focus creates self-fulfilling dynamics where resistance functions precisely because market participants expect it to.
The pattern of multiple rejections at $200 followed by retreat reinforces this resistance rather than weakening it. Some technical theories suggest levels become weaker with repeated tests, but empirical evidence often shows the opposite—repeated failures to break resistance convince more participants that the level will hold, increasing their willingness to sell at those prices and strengthening the barrier.
This overhead resistance creates a challenging environment for bulls attempting to drive prices higher. Not only must they absorb current selling pressure reflected in exchange flows and CMF, but they also need sufficient buying power to clear the accumulated supply at $200 from previous failed attempts. This dual burden—fighting current distribution and past overhead resistance—typically requires substantial catalyst or capitulation washout before successful breakouts occur.
Critical Support at $183 Defines Near-Term Structure
Solana currently trades at $185, holding marginally above the $183 support level that defines the immediate downside boundary of current consolidation. This proximity to support with weakening liquidity flows and emerging selling pressure creates a high-probability scenario where $183 will be tested decisively in coming sessions.
Support levels derive meaning from previous price action where buying interest emerged to prevent further declines. The $183 level represents a zone where buyers previously stepped in with sufficient force to establish a local low. However, support only remains valid as long as the buying interest that created it persists—if market conditions have shifted such that buyers are no longer willing to defend these levels, support breaks rather than holds.
The current context of six-month low CMF readings and emerging exchange outflows suggests the buyer conviction that established $183 as support may have weakened. If holders who were accumulating or holding positions are now distributing, it implies reduced willingness to buy dips at levels that previously attracted interest. This shift in participant behavior threatens support levels that rely on consistent buyer presence.
A confirmed breakdown below $183 would likely trigger technical stop losses and discretionary selling from traders using this level as their risk management threshold. Such breakdown often accelerates initially as stops trigger, creating temporary selling pressure that pushes prices beyond the support level before finding equilibrium at the next support zone.
Downside Targets Emerge Below $183 Support
If Solana breaks below the $183 support level, technical analysis identifies $175 as the next likely target based on previous consolidation zones and Fibonacci retracement levels from the recent advance. This level represents approximately 6% downside from current prices—a meaningful but not catastrophic decline that would maintain the broader ascending structure visible on longer timeframes.
Extended weakness beyond $175 could push Solana toward $170, representing a roughly 8% decline from current levels. This scenario would require either sustained selling pressure that overwhelms all support zones or broader crypto market weakness that drags Solana lower regardless of its individual technical structure.
The $170 level carries significance as a more substantial retracement that would test the conviction of longer-term holders who accumulated during the earlier advance. Declines to this level might trigger additional selling from participants whose stop losses sit below $175, or conversely might attract value buyers viewing the deeper retracement as attractive entry opportunity.
These downside targets assume consolidation or decline rather than panic selling or capitulation scenarios. If market psychology shifts dramatically—perhaps triggered by unexpected negative catalysts or broader risk-off conditions—declines could extend beyond these technical levels toward deeper support zones around $160 or lower. However, such scenarios would require material change in market conditions beyond what current data suggests.
Bullish Scenario Requires $200 Reclaim
Despite current weakness, Solana maintains potential for bullish resolution if it can rebound from the $183 support level and successfully breach the $200 resistance that has repeatedly rejected rally attempts. This scenario would require reversal in the negative trends evident in exchange flows and CMF—specifically, a shift back toward accumulation and liquidity inflows rather than distribution.
A successful close above $200 would accomplish several objectives simultaneously. First, it would clear the overhead resistance and trapped supply from previous failed breakout attempts. Second, it would invalidate the bearish setup suggested by weakening on-chain metrics. Third, it would likely trigger short covering and momentum buying from traders who positioned for continued consolidation or decline.
Beyond the $200 threshold, technical analysis projects initial targets near $208 based on recent consolidation ranges and pattern measurements. This level represents approximately 12% upside from current prices—sufficient to attract momentum-oriented traders while remaining plausible given recent trading ranges.
Extended upside following a clean $200 break could target higher resistance zones, though such projections become increasingly speculative without seeing how price behaves after initial breakout. The magnitude of any post-breakout rally would depend on whether the move triggers genuine shift back toward accumulation or merely represents short covering that fades quickly.
For this bullish scenario to materialize, several conditions would need to align. Capital inflows must reverse, as indicated by CMF turning positive and exchange net flows shifting back toward accumulation. Broader crypto market conditions would ideally support risk-on positioning that benefits altcoins. Some catalyst—whether Solana ecosystem developments, favorable regulatory news, or simply technical momentum—would need to convince traders that $200 will break rather than hold again.
Broader Market Context Matters for Solana
Solana’s struggles below $200 occur against a backdrop of mixed signals across cryptocurrency markets broadly. Bitcoin’s consolidation near all-time highs typically correlates with altcoin weakness as capital concentrates in the dominant cryptocurrency, making it challenging for alternative tokens to sustain rallies independent of broader market direction.
The relationship between Bitcoin dominance and altcoin performance remains relevant for Solana’s near-term prospects. If Bitcoin breaks toward new highs while maintaining market dominance, altcoins including Solana might continue facing distribution pressure as traders rotate capital toward BTC. Conversely, if Bitcoin consolidates or corrects while dominance declines, it could trigger the “altcoin season” conditions where SOL and similar tokens outperform.
Macro factors including traditional market performance, regulatory developments, and institutional crypto adoption trends all influence the risk appetite that determines whether investors buy or sell altcoin exposure. The six-month low in CMF and emerging exchange outflows suggest current conditions don’t favor aggressive altcoin accumulation, though this could shift quickly if catalysts emerge.
What Traders Should Monitor
Several specific developments will determine whether Solana’s current weakness extends into more substantial correction or reverses toward bullish breakout. First, watch whether $183 support holds on daily closes. Intraday breaks below support that recover before close often represent false breakdowns rather than confirmed support failure.
Second, monitor exchange flow data for any reversal from current outflows back toward accumulation. Such reversal would indicate renewed confidence emerging among holders and would provide early signal that selling pressure may be exhausting.
Third, track CMF for any upturn from current six-month lows. Even modest improvement would suggest the worst of the distribution may be passing and that liquidity conditions are stabilizing if not yet improving.
Fourth, observe how price behaves at the $175 level if $183 breaks. Strong support at $175 would indicate buyers remain willing to defend deeper levels and would increase probability of consolidation rather than extended decline. Conversely, easy break of $175 would suggest selling pressure remains intense and that deeper targets may be reached.
Finally, watch for any Solana-specific catalysts including network upgrades, major protocol integrations, or institutional adoption announcements that could shift the narrative and attract fresh capital regardless of broader market conditions.
For now, Solana price remains in a vulnerable position where technical resistance, weakening on-chain metrics, and proximity to support create conditions favoring near-term weakness unless market dynamics shift. The next week will likely clarify whether current distribution represents temporary profit-taking within an ongoing uptrend or the beginning of more substantial correction that requires deeper retracement before resuming the advance.