Dogecoin Price Faces Breakdown Risk as Long-Term Holders Flip to Massive Selling in 367% Behavioral Reversal
In Brief
Dogecoin price vulnerable at $0.18 as long-term holder behavior reversed 367% in 24 hours, flipping from +8.2 million DOGE inflows to -22 million outflows.
Critical support cluster between $0.177-$0.179 contains 3.78 billion DOGE accumulated by long-term holders, yet sustained selling pressure threatens this floor.
Imminent 100-200 EMA death cross represents stronger bearish signal than October’s 50-200 cross, reflecting sustained weakness rather than temporary volatility.
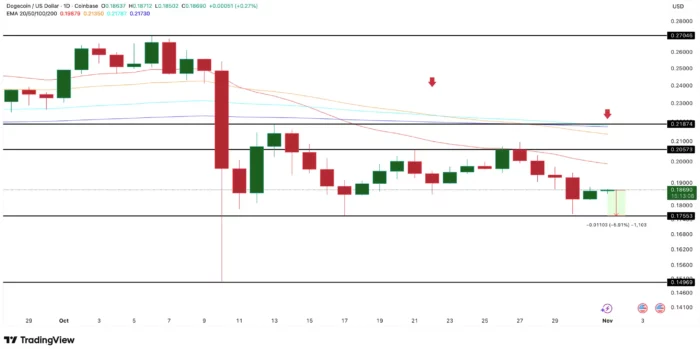
Next significant support doesn’t appear until $0.14 if current $0.17 floor breaks, creating potential 6% downside gap with minimal intermediate buying zones.
DOGE down 5.9% weekly and 27% monthly despite modest 1.2% bounce, with immediate resistance at $0.20-$0.21 capping recovery attempts since October 13.

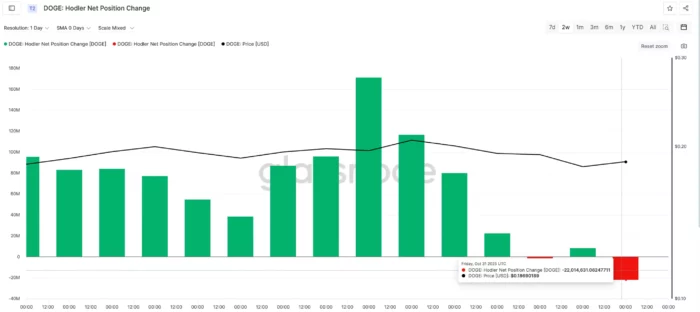
Dogecoin price is facing mounting breakdown pressure at $0.18 as long-term holders execute a dramatic behavioral reversal, shifting from accumulation to aggressive distribution in a 367% swing that occurred within just 24 hours. The Hodler Net Position Change metric flipped from +8.2 million DOGE inflows to -22 million outflows on October 31, signaling that even patient holders who weathered previous volatility are now exiting positions as conviction weakens.
This behavioral shift threatens the critical $0.177-$0.179 support cluster where 3.78 billion DOGE was accumulated, creating a high-stakes scenario where the support zone that has held since October 11 faces its most serious test. The combination of accelerating long-term holder selling and an imminent death cross between the 100-day and 200-day exponential moving averages creates technical conditions that historically precede substantial corrections.
367% Holder Behavior Reversal Signals Conviction Loss
The Hodler Net Position Change metric—which specifically tracks whether long-term holder wallets are accumulating or distributing—experienced a dramatic reversal on October 31 that represents one of the sharpest behavioral shifts observed in Dogecoin’s recent trading history. The metric plunged from positive inflows of 8.2 million DOGE to negative outflows of 22 million DOGE within a 24-hour period, representing a 367% swing in holder positioning.
This reversal carries particular significance because it involves long-term holders rather than short-term traders. Long-term holder cohorts typically demonstrate higher conviction and greater resistance to volatility, as evidenced by their willingness to maintain positions through price fluctuations that shake out weaker hands. When these patient holders flip to aggressive selling, it signals fundamental reassessment rather than tactical position adjustment.
The magnitude of the reversal—not just the direction but the speed—suggests this represents coordinated decision-making across multiple large wallets rather than isolated profit-taking. A 30 million DOGE differential between the previous day’s inflows and current outflows indicates substantial capital movement that typically requires either significant catalyst or widespread loss of confidence in near-term prospects.
The timing of this behavioral shift coinciding with Dogecoin’s failure to reclaim the $0.20 level after multiple attempts creates a narrative where long-term holders appear to be losing patience with consolidation. Having held through October’s volatility expecting eventual breakout, these holders now seem to be concluding that resistance will hold and that current levels represent appropriate exit points before potential further weakness.
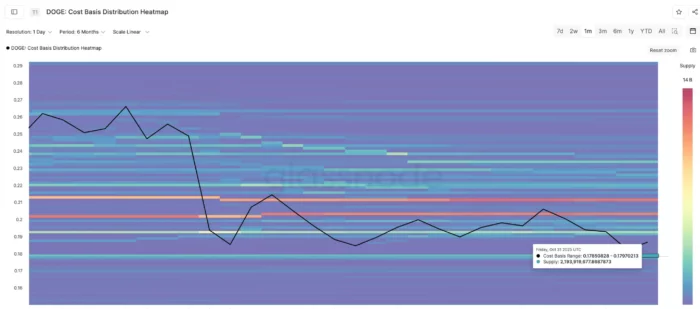
Cost Basis Heatmap Reveals Critical Support Concentration
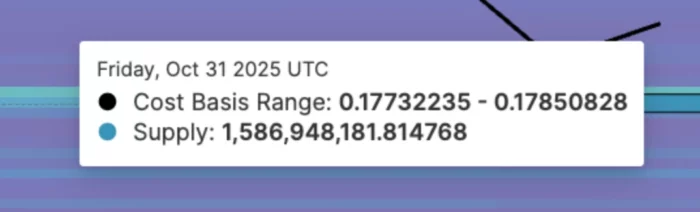
On-chain cost basis data identifies the $0.177-$0.179 range as containing the heaviest concentration of long-term holder supply, with approximately 3.78 billion DOGE accumulated at these levels. Cost basis analysis reveals where holders last acquired their tokens, identifying price zones where selling pressure typically emerges as participants defend break-even levels or take profits on marginal gains.
This particular cluster has functioned as reliable support since October 11, with the zone absorbing selling pressure during previous tests and generating bounces that prevented deeper corrections. The concentration of supply at these levels creates what traders term “thick support”—price zones where substantial buying interest exists because many holders view these levels as value entry points or psychological floors worth defending.
However, the protective value of cost basis clusters depends critically on holder conviction remaining intact. If holders who accumulated in this range lose confidence and begin distributing rather than defending their entry levels, the support transforms from thick buffer to supply overhang. The current 367% reversal in holder behavior suggests exactly this transformation may be occurring.
The mechanics work as follows: holders with cost basis near $0.177-$0.179 face decision between holding through current weakness hoping for recovery or exiting near break-even to avoid watching profitable positions become losses. When conviction weakens—as evidenced by the dramatic shift in net position data—these holders increasingly choose exit over patience, converting what was support into resistance as their selling overwhelms buying interest.
The “last line of defense” characterization reflects that below the $0.177-$0.179 cluster, cost basis analysis shows a significant gap until the next major accumulation zone near $0.14. This gap means that if the current support breaks, there exists minimal intermediate buying interest to slow decline until price reaches substantially lower levels where a different holder cohort accumulated their positions.
Imminent Death Cross Carries Greater Bearish Weight
Dogecoin’s moving average structure is developing a second death cross pattern that carries more bearish significance than the initial crossover that occurred in late October. The first death cross—where the 50-day exponential moving average crossed below the 200-day EMA—marked the beginning of Dogecoin’s current downtrend and preceded the 5.9% weekly decline and 27% monthly deterioration.
The imminent crossover involves the 100-day EMA dropping below the 200-day EMA, representing a stronger bearish signal because both averages incorporate longer timeframes. The 50-day EMA responds relatively quickly to price changes and can generate death crosses from temporary weakness, while the 100-day EMA requires more sustained deterioration before crossing below the 200-day average.
This distinction matters because traders assign greater weight to signals involving longer-period moving averages. A death cross between intermediate and long-term averages suggests the weakness reflects persistent trend change rather than temporary volatility or consolidation within an ongoing uptrend. Markets often respond more dramatically to these higher-timeframe signals as they confirm rather than merely suggest trend reversals.
The progression from the initial 50-200 death cross to the impending 100-200 death cross indicates deterioration is intensifying rather than stabilizing. If the downtrend were losing momentum, these longer-period averages would be flattening or showing signs of support rather than confirming additional bearish crossovers. The sequential nature of the crosses—first shorter-term, then intermediate-term—demonstrates cascading weakness across multiple timeframes.
Historical analysis of similar death cross patterns in Dogecoin suggests these setups often precede additional 5-10% declines as the technical signal triggers momentum-based selling and discretionary exits from traders using moving average crosses as decision frameworks. The current setup projecting potential move from $0.18 toward $0.14 represents approximately 6% downside, fitting within this historical precedent range.
Support Gap Creates Amplified Breakdown Risk
The cost basis heatmap’s revelation that the next significant support cluster doesn’t emerge until $0.14—roughly 6% below the current $0.177-$0.179 support—creates conditions where breakdown could accelerate rather than finding intermediate levels to slow decline. This gap in meaningful support represents what technical analysts call “air pocket” conditions where price can fall rapidly once initial support breaks.
The mechanism driving accelerated declines in such conditions involves both technical and psychological factors. Technically, the absence of substantial accumulated supply between $0.17 and $0.14 means fewer holders have cost basis in this range who might defend their entry levels or view the zone as attractive accumulation opportunity. Psychologically, rapid decline through regions with minimal resistance often triggers panic as participants observe price falling without finding support.
This setup creates asymmetric risk where the path of least resistance points downward. Bulls attempting to defend $0.17 must absorb all selling pressure including the accelerated long-term holder distribution, while bears need only overwhelm this support to trigger potentially rapid move to $0.14 where next meaningful buying interest resides. The risk-reward calculation favors bears in such configurations.
The 6% downside projection from $0.17 to $0.14 may understate actual risk if breakdown triggers cascading stop losses or momentum-based selling. Technical breakdowns often overshoot initial targets as selling begets more selling through forced liquidations and discretionary exits from participants whose risk tolerance is exceeded. The gap in support means such overshoots could extend toward $0.13 or lower before finding equilibrium.
Resistance Structure Limits Recovery Potential
Even as downside risks mount, Dogecoin faces substantial resistance that caps recovery attempts and creates conditions unfavorable for reversal. Current price near $0.18 sits below immediate resistance at $0.20, with more significant barrier at $0.21—a level untested since October 13 that represents nearly two weeks of failed breakout attempts.
The $0.20 level carries psychological significance as a round number that naturally attracts orders and decision-making, while the $0.21 threshold represents the high-water mark from mid-October before the current deterioration began. For bulls to invalidate the bearish setup created by long-term holder selling and impending death crosses, they must not only reclaim these levels but demonstrate ability to hold them as support rather than merely touching them temporarily.
The resistance structure becomes more problematic when considered alongside the accelerating distribution from long-term holders. Each rally attempt toward $0.20 now faces selling not just from traders taking profits on bounces but also from long-term holders using strength to exit positions they’ve decided to liquidate. This layered selling pressure—both tactical profit-taking and strategic position liquidation—creates thick resistance that typical bounce attempts struggle to overcome.
The requirement for daily close above $0.21 to invalidate bearish bias sets a high bar that current momentum appears unlikely to achieve. The modest 1.2% bounce referenced in the data represents typical dead-cat bounce behavior where selling pressure temporarily exhausts allowing minor recovery before distribution resumes. Without genuine catalyst or dramatic shift in holder behavior back toward accumulation, these weak bounces typically fail at resistance and set up next leg lower.
Monthly Performance Reflects Deepening Weakness
Dogecoin’s 27% decline over the past month places the current weakness in broader context that suggests this represents more than temporary consolidation or healthy correction. A near-30% drawdown in a single month qualifies as significant deterioration that typically requires either substantial catalyst to reverse or extended consolidation period to repair technical damage and rebuild buyer confidence.
The 5.9% weekly decline demonstrates the weakness is accelerating rather than stabilizing, with recent sessions showing steeper losses than earlier in the month. This acceleration often characterizes transitions from correction within uptrend to potential trend reversal, particularly when accompanied by behavioral shifts like the long-term holder distribution currently evident.
The modest 1.2% gain referenced in the opening represents insufficient strength to suggest reversal is imminent. Genuine bottoming processes typically feature strong reversal candles or sustained multi-day bounces that demonstrate buyers are stepping in with conviction rather than weak bounces that barely offset single-session declines. Current price action suggests exhaustion selling hasn’t yet occurred—the flush that often marks final capitulation and creates conditions for sustainable reversal.
What Could Reverse the Bearish Setup
While current conditions strongly favor additional downside, several developments could invalidate the bearish thesis and trigger reversal. Most directly, a shift in long-term holder behavior back toward accumulation would remove the primary driver of current weakness. If the Hodler Net Position Change flipped back to positive with sustained inflows matching or exceeding the recent outflows, it would signal that distribution has exhausted and accumulation is resuming.
Technical invalidation requires daily close above $0.21 that holds on subsequent retests, demonstrating the resistance has converted to support. Such a move would likely require substantial buying volume—significantly above recent averages—to convince participants that genuine reversal rather than temporary squeeze is occurring. The volume confirmation matters because low-volume breakouts often fail quickly, while high-volume breaks tend to sustain.
Broader market catalysts could overwhelm Dogecoin-specific weakness if risk appetite improves dramatically across cryptocurrency markets. Meme coins including Dogecoin tend to demonstrate high beta to overall crypto market sentiment, meaning strong rallies in Bitcoin or Ethereum often lift DOGE regardless of individual technical condition. However, such relief would likely prove temporary unless accompanied by improvement in Dogecoin-specific holder behavior and technicals.
Social media-driven enthusiasm or celebrity endorsements—factors that have historically driven Dogecoin rallies—could also override technical bearishness if sufficient retail attention materializes. However, the current long-term holder distribution suggests even if such enthusiasm emerges, it would face substantial selling pressure from holders using any strength to exit positions, potentially capping rallies below key resistance levels.
Risk Management for Current Holders
For participants currently holding Dogecoin, the combination of accelerating long-term holder distribution, imminent death cross, and vulnerable support position creates decision points requiring clear risk assessment. Holders must evaluate whether their conviction justifies maintaining positions through potential decline to $0.14 or whether current levels represent appropriate exit points before further deterioration.
Stop losses positioned below $0.17 or $0.175 would limit downside exposure while allowing positions to survive typical volatility. However, the gap in support until $0.14 means such stops could trigger during rapid decline that subsequently reverses, creating the frustrating scenario where holders are stopped out near lows. This dilemma—risk of holding through substantial decline versus risk of being stopped out before reversal—characterizes difficult trading environments where neither holding nor exiting offers clear advantage.
Position sizing adjustments represent alternative to all-or-nothing decisions about holding versus exiting. Reducing exposure by 25-50% captures some profit or limits losses while maintaining upside participation if reversal occurs. This compromise approach acknowledges the unfavorable setup while recognizing that markets can reverse against technical probabilities.
For traders considering new positions, the setup clearly favors waiting for either breakdown confirmation below $0.17 to position for move to $0.14, or reversal confirmation above $0.21 to position for recovery. Attempting to catch falling knife by buying current weakness faces the challenge that long-term holders—typically the most convicted participants—are actively selling, suggesting the path of least resistance points lower before bottoming process completes.
Near-Term Outlook Remains Challenged
The convergence of accelerating long-term holder distribution, imminent bearish death cross, and vulnerable support position creates conditions where Dogecoin price faces substantial near-term downside risk. The 367% behavioral reversal among patient holders signals conviction loss that typically requires either significant time or substantial catalyst to repair.
The critical $0.177-$0.179 support cluster that has held since October 11 now faces its most serious test as the very holders whose accumulation created this support zone appear to be distributing. If this support breaks, the gap until $0.14 suggests potential for rapid 6% decline with risk of overshoot toward $0.13 if selling accelerates.
Recovery scenarios exist but require either dramatic reversal in holder behavior back toward accumulation or catalyst sufficient to attract new buying interest that overwhelms current distribution. Until such shifts materialize, the technical and behavioral setup favors patience from prospective buyers and defensive positioning from existing holders.
The next several trading sessions will clarify whether the $0.17 support withstands the current selling pressure or succumbs to the combination of long-term holder distribution and bearish technical signals. The outcome will determine whether Dogecoin’s weakness represents deep correction within ongoing uptrend or transition to sustained downtrend requiring substantial repair time before recovery becomes viable.