In Brief
Bitcoin price slipped 1% to $108,200 after sellers rejected breakout attempt near $114,000, yet broader bullish structure remains intact.
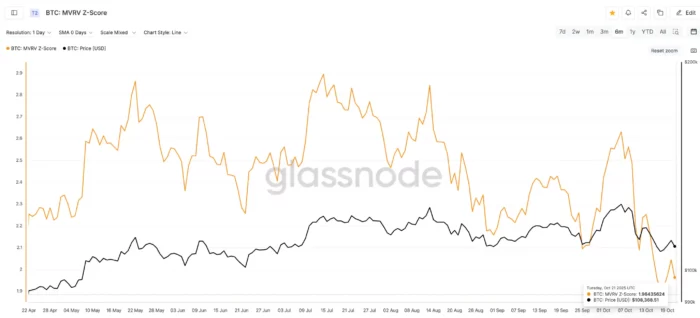
MVRV Z-score climbed from 1.90 to 1.96, matching the higher-low pattern that preceded September’s 14% rally to $124,714.
Long-term holder selling collapsed 99.6% while short-term selling dropped 98.9%, indicating near-complete exhaustion across both cohorts.
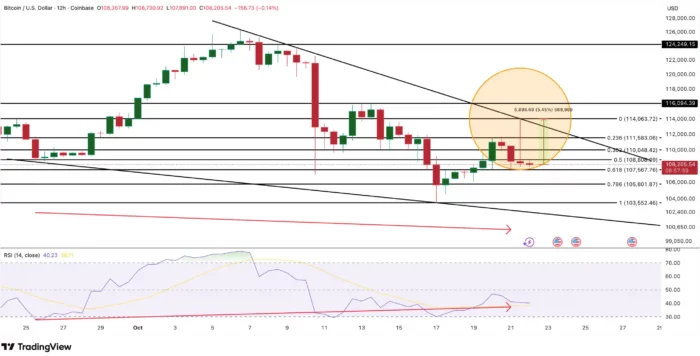
Falling wedge pattern on 12-hour charts points toward bullish resolution, with breakout target at $111,500 opening path to $116,000.
RSI bullish divergence between September 25 and October 21 suggests fading selling momentum despite lower price action.

Bitcoin price is testing support near $108,200 after sellers rejected what appeared to be a bullish breakout attempt, pushing BTC back from daily highs above $114,000. The 1% decline over 24 hours dampened immediate bullish sentiment, yet beneath the surface, on-chain metrics reveal selling pressure approaching exhaustion levels rarely seen outside major market bottoms.
While short-term price action shows hesitation, multiple data points suggest this consolidation phase may be setting up conditions for the next leg higher rather than signaling trend failure.
MVRV Z-Score Pattern Mirrors September Rally Setup
The MVRV Z-Score—which measures the ratio between Bitcoin’s market capitalization and realized capitalization—currently sits at 1.96 after bouncing from a three-month low of 1.90 on October 17. This modest recovery carries more significance than the small numerical change might suggest.
This metric essentially compares Bitcoin’s current market value against its aggregate cost basis across all holders. Readings below 2.0 historically indicate the asset is trading near or below fair value, creating conditions where longer-term holders see little reason to sell while value-oriented buyers find attractive entry points.
The current pattern directly mirrors a setup that preceded substantial gains just weeks ago. Between September 25 and September 27, the MVRV Z-Score formed a higher low, rising from 2.09 to 2.11. Bitcoin price subsequently rallied 14% within seven days, climbing from $109,692 to $124,714.
Today’s configuration shows the same characteristic higher-low structure, suggesting accumulation is occurring at progressively higher valuations—a shift in market psychology that typically precedes upward price movements. The pattern indicates long-term holders aren’t capitulating despite recent weakness, instead choosing to maintain positions through volatility.
Selling Activity Collapses Across Multiple Time Horizons
The Spent Coins Age Band metric provides granular insight into which holder cohorts are moving supply, and recent data reveals a dramatic collapse in selling activity across both long-term and short-term groups.
Coins held between 365 days and two years—typically representing patient accumulation by conviction holders—saw spent volume plummet from 25,263 BTC to just 103 BTC between October 14 and October 22. This 99.6% decline represents one of the sharpest drops in long-term holder distribution this year.
Simultaneously, short-term holders who acquired Bitcoin within the past 7-30 days reduced their selling from 13,273 BTC to merely 145 BTC in the last 24 hours—a 98.9% collapse. This cohort typically includes traders and speculators most sensitive to short-term price movements, making their withdrawal from selling particularly noteworthy.
The convergence of these two data points creates a compelling narrative: long-term holders see no reason to exit despite extended consolidation, while short-term profit-takers have largely exhausted their selling. Both groups reaching monthly lows in distribution simultaneously is relatively rare and often precedes periods where limited supply meets even modest demand increases.
When coins stop moving, price volatility tends to compress until a catalyst emerges to break the equilibrium. Given that selling has declined rather than buying disappearing, the probability skews toward upside resolution.
Technical Structure Maintains Bullish Framework Despite Rejection
Chart analysis reveals Bitcoin continues trading within a falling wedge formation on 12-hour timeframes—a pattern that resolves upward approximately 68% of the time according to historical precedent. The wedge’s converging trendlines indicate volatility compression, with diminishing price swings typically preceding significant directional moves.
Bitcoin briefly tested the wedge’s upper boundary near $114,000 during the latest session before sellers emerged, creating a long upper wick that pushed price back toward $108,000. This rejection might appear bearish in isolation, yet the subsequent price action tells a more nuanced story.
Following the rejection, a doji candlestick formed—a pattern characterized by small bodies and similar open/close prices. Doji formations signal indecision between buyers and sellers, often appearing at inflection points before trend changes. When doji patterns emerge at resistance levels within bullish continuation structures like falling wedges, they frequently mark the final phase of consolidation before breakouts.
The Relative Strength Index adds another layer of bullish evidence through divergence analysis. While Bitcoin price established lower lows from September 25 through October 21, the RSI simultaneously formed higher lows across the same period. This bullish divergence indicates momentum is shifting despite price weakness—selling pressure is diminishing even as price makes new short-term lows.
Divergences between price and momentum indicators rank among the most reliable technical signals, particularly when they persist across multiple weeks rather than appearing as isolated occurrences.
Breakout Levels and Price Targets
The current technical setup provides clearly defined parameters for both bullish and bearish scenarios, allowing traders to establish specific trigger levels.
Primary resistance: Bitcoin must close above $111,500 to confirm a breakout from the falling wedge pattern. This level represents the wedge’s upper boundary and functions as the initial confirmation threshold. A decisive close above this resistance would validate the pattern and likely trigger momentum-based buying from technical traders.
Initial targets: A confirmed breakout projects toward $114,000 based on the wedge’s height measured from its widest point. This represents approximately 5% upside from current levels and would retest the area where recent rejection occurred.
Extended targets: Strong momentum above $114,000 opens the path toward $116,000, with potential for continuation to $124,200 if buying accelerates. The higher target aligns with September’s peak and represents a 15% gain from current price.
Critical support: The structure remains valid as long as Bitcoin holds $107,500. A breakdown below this level would delay the bullish scenario and require consolidation time to rebuild. More significantly, a decline below $103,500 would invalidate the falling wedge pattern entirely and suggest the larger structure might be forming a different configuration.
Why Confluence Matters More Than Individual Signals
The strength of the current setup stems not from any single indicator but from the convergence of multiple independent data sources pointing toward similar conclusions.
On-chain metrics show both long-term conviction holders and short-term speculators have stopped selling. Valuation models indicate price is trading near fair value where accumulation typically occurs. Chart patterns suggest volatility compression within a historically bullish formation. Momentum indicators display divergence signaling weakening downside pressure.
Each data point alone carries some predictive value, but their simultaneous alignment significantly increases the probability that market structure is transitioning from distribution to accumulation. Markets rarely provide such clear roadmaps, making current conditions particularly actionable for those monitoring key levels.
Near-Term Catalysts and Risk Factors
Several factors could serve as catalysts for the technical breakout that on-chain data suggests is building. Institutional buying flows have remained subdued through October’s consolidation, creating pent-up demand that could emerge once directional clarity appears. Options expiry events scheduled for month-end may reduce hedging pressure that’s capped recent rallies.
Conversely, macro headwinds persist. Continued strength in traditional markets could draw capital away from crypto assets. Regulatory developments remain unpredictable. Geopolitical tensions create periodic risk-off sentiment that pressures speculative assets.
However, the on-chain evidence of selling exhaustion suggests Bitcoin has already absorbed these concerns. The market has had weeks to respond to negative catalysts, yet holders chose retention over distribution—a sign that current levels represent acceptable value even amid uncertainty.
What to Watch in Coming Days
The next 48-72 hours will likely determine whether this consolidation resolves as technical patterns suggest or requires additional base-building time. Three specific developments warrant close monitoring.
First, observe whether spent coin volumes remain suppressed or begin increasing again. A sustained low in selling activity would confirm exhaustion rather than temporary pause.
Second, watch for Bitcoin to reclaim and hold $111,000 as support. Resistance levels that flip to support often mark transitions from consolidation to trending phases.
Third, monitor whether RSI can break above 50 on daily timeframes while price pushes toward wedge resistance. Momentum confirming price strength would add conviction to breakout attempts.
For now, Bitcoin price remains coiled within a narrowing range, with sellers appearing increasingly exhausted while the technical structure maintains bullish characteristics. The setup suggests patience may reward those willing to wait for confirmation, but the groundwork for the next move higher appears to be solidifying beneath current price levels.