In Brief
Ethereum price remains stuck near $3,875 despite whales accumulating 170,000 ETH worth approximately $660 million in 48 hours
Short-term holders dumped coins across three key cohorts, with 1-week to 1-month holders dropping from 8.79% to 7.79% of supply.
Technical indicators show bullish divergence on daily charts, with ETH forming an ascending triangle pattern.
Critical breakout level sits at $4,137, requiring 7% move to confirm upside momentum toward $4,495-$4,950 targets.
Support breakdown below $3,806 would invalidate bullish structure and open path to $3,355.
Ethereum price is testing investor patience as whale wallets absorb massive quantities of ETH while short-term traders continue dumping into every bounce, creating a standoff that’s kept the asset range-bound near $3,875 through October.
The second-largest cryptocurrency has declined 3.7% this week, showing minimal reaction to what represents one of the month’s largest accumulation events by large holders. This disconnect between whale behavior and price action raises questions about whether institutional buying can overcome persistent retail selling pressure.
Whale Wallets Absorb $660 Million in Two-Day Buying Spree
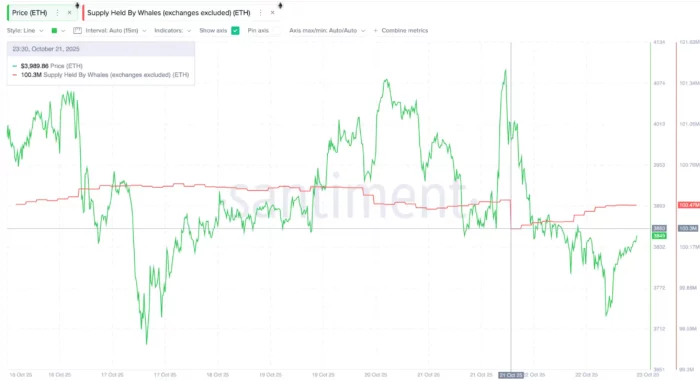
On-chain metrics reveal Ethereum whales added approximately 170,000 ETH between October 21 and October 23, expanding their collective holdings from 100.30 million to 100.47 million ETH. At current valuations, this accumulation represents roughly $660 million in fresh capital deployment—marking one of October’s most significant whale buying episodes.
The magnitude of this absorption becomes clearer when examining the velocity: these large wallets accumulated nearly $330 million per day during this 48-hour window. This buying intensity typically signals conviction among sophisticated holders who view current price levels as attractive entry points.
Whale cohorts generally represent entities with stronger conviction and longer time horizons—exchanges, institutional funds, and high-net-worth individuals who can weather volatility. Their willingness to add substantial positions suggests these participants see value others are missing.
Short-Term Holders Stage Coordinated Exit
While whales accumulated, HODL Waves data exposes a simultaneous exodus among short-term holder cohorts. Three distinct groups reduced their supply percentage since mid-October, revealing a clear pattern of profit-taking and risk reduction among recent buyers.
The 24-hour holder cohort contracted from 0.887% to 0.48% of total supply—a 46% decline indicating minimal new speculative interest. Traders holding between one day and one week decreased their share from 2.22% to 2.01%, while the one-week to one-month group dropped from 8.79% to 7.79%.
This final cohort’s reduction is particularly telling. These holders accumulated during September’s rally and are now distributing after facing weeks of sideways price action. Their selling represents approximately 1% of circulating supply—roughly 1.2 million ETH—flowing from weak hands to stronger ones.
The divergence creates what technical analysts call a “wall of doubt”—a scenario where confident accumulation by large players meets persistent distribution by smaller traders. Until this short-term holder selling exhausts itself or converts to buying, whale demand alone struggles to generate sustained upward momentum.
Technical Structure Points Toward Resolution
Despite conflicting holder behavior, Ethereum’s chart structure maintains bullish characteristics that suggest accumulation may ultimately prevail over distribution.
Daily price action shows Ethereum forming lower lows from September 25 through October 22, yet the Relative Strength Index simultaneously established higher lows across the same timeframe. This bullish divergence typically signals weakening selling pressure even as price makes new short-term lows—often a precursor to trend reversals.
Additionally, ETH is trading within an ascending triangle formation, a continuation pattern that statistically resolves upward approximately 70% of the time once resistance breaks. The pattern’s upper boundary aligns with two critical Fibonacci retracement levels: $3,989 and $4,137.
The $4,137 threshold carries particular significance as it represents the 61.8% Fibonacci retracement of the recent decline—a level that often separates corrective bounces from genuine trend reversals. A daily close above this resistance would require approximately a 7% move from current levels but would validate the triangle breakout and confirm accumulation phase completion.
Price Scenarios: Breakout Targets vs Breakdown Risks
The current technical setup presents clearly defined risk-reward parameters for both bullish and bearish scenarios.
Bullish case: A confirmed daily close above $4,137 would activate the ascending triangle pattern, projecting initial targets toward $4,495 based on the pattern’s height. Extended upside could reach $4,950 if momentum accelerates, representing potential gains of 16-28% from current levels.
This scenario requires short-term holder selling to exhaust while whale accumulation continues. Historically, such transitions occur when weaker hands fully capitulate, removing overhead supply that has capped rallies.
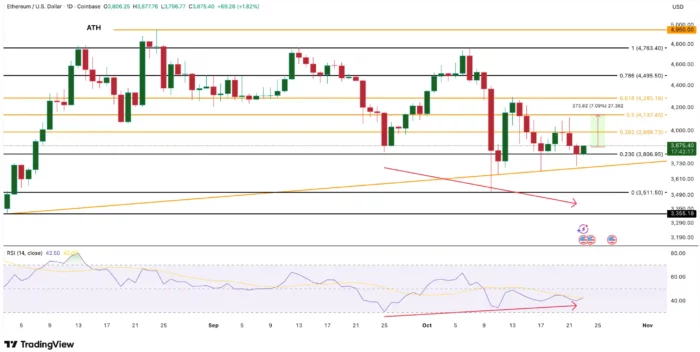
TradingView
Bearish case: Failure to maintain support at $3,806 would break the ascending triangle’s lower trendline and invalidate the bullish structure. Such a breakdown could trigger stops and accelerate selling toward $3,511, with further downside risk extending to $3,355 if momentum builds.
This outcome becomes more likely if whale accumulation slows while short-term holder distribution continues or accelerates. The $3,806 level represents the September low and functions as a critical line separating corrective consolidation from renewed downtrends.
What Market Structure Reveals About Timing
The current standoff between accumulating whales and distributing retail traders rarely persists indefinitely. Historical patterns suggest these transitions typically resolve in one of two ways.
First, retail holders exhaust their selling, removing supply overhang and allowing whale demand to push prices higher. This resolution often follows extended consolidation periods where weak holders lose patience and exit.
Second, whales complete their accumulation targets and step back, allowing price to drift lower until finding new equilibrium where fresh buyers emerge. This scenario tends to develop when broader market conditions deteriorate or fundamental catalysts fail to materialize.
Current conditions suggest the former scenario carries higher probability. Whale accumulation velocity remains strong, short-term holder supply percentage is declining rapidly, and technical patterns indicate a coiling structure preparing for expansion rather than collapse.
Critical Week Ahead for Ethereum’s Direction
The next five to seven trading days will likely determine whether Ethereum’s accumulation phase transitions to markup or requires additional base-building time. Three factors warrant close monitoring.
First, watch whether whale wallets continue absorbing supply at recent rates or reduce buying activity. Sustained accumulation suggests conviction remains intact, while declining inflows might signal larger players are satisfied with current positions.
Second, track short-term holder behavior for signs of capitulation or renewed confidence. A reversal in selling pressure would remove a significant headwind currently capping rallies.
Third, observe whether Ethereum can reclaim $3,989 and hold it as support. This initial resistance level serves as a preliminary test before the more significant $4,137 breakout threshold.
For now, Ethereum price remains in limbo—whales building positions while shorter-term participants head for exits. Resolution approaches, but which side wins this tug-of-war will determine whether ETH targets $4,900 or $3,300 in coming weeks.
Missed buying crypto at the market bottom?
No worries, there's a chance to win in crypto casinos! Practice for free and win cryptocurrency in recommended casinos! Our website wheretospin.com offers not only the best casino reviews but also the opportunity to win big amounts in exciting games.
Join now and start your journey to financial freedom with WhereToSpin!
Middle East
wheretospininkuwait.com provides a comprehensive selection of trusted online casino reviews for the Middle East أفضل كازينو على الإنترنت. The platform features well-established casinos supporting crypto deposits in the region, including Dream Bet, Haz Casino, Emirbet, YYY Casino, and Casinia.
South Africa and New Zealand
In the South African online casino market, wheretospin.co.za highlights top-rated platforms and online casinos such as True Fortune Casino and DuckyLuck. Meanwhile, for New Zealand players, wheretospin.nz showcases highly recommended casinos, including Casinia, Rooster.bet, and Joo Casino.