Bitcoin Price Repeats Pattern That Sparked 15% Rally — Critical Resistance at $116,500 Holds Key
In Brief
Bitcoin price trades near $111,000 with hidden bullish divergence on RSI matching the exact signal that preceded September’s 15.7% surge.
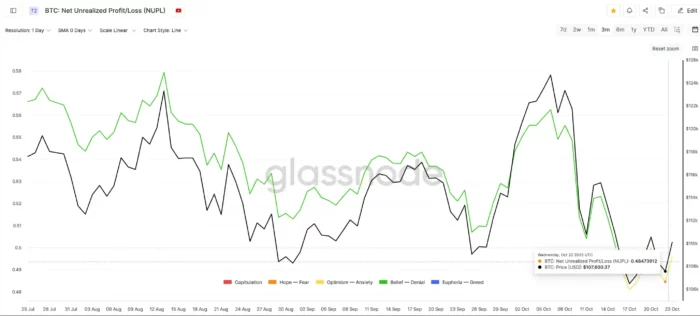
Net Unrealized Profit/Loss sits at three-month low of 0.48, indicating minimal selling incentive among current holders.
Accumulation Trend Score climbed back to 1, confirming large wallet entities have resumed aggressive buying after period of inactivity.
Decisive close above $116,500 resistance would validate bullish setup and project targets toward $119,700-$125,700 range.
Support breakdown below $110,050 would invalidate pattern and expose Bitcoin to deeper correction toward $106,600.
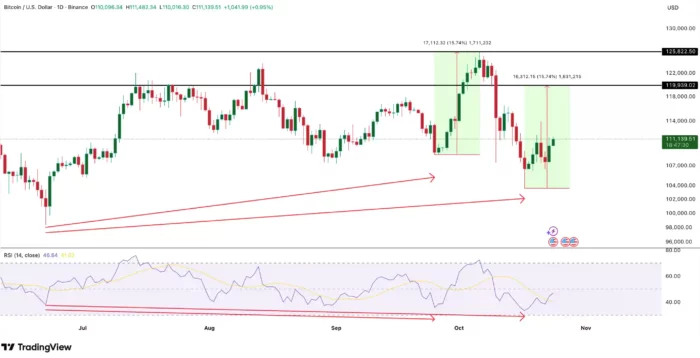
Bitcoin price is flashing a technical signal that historically precedes significant upside moves, with the same hidden bullish divergence pattern now appearing that triggered a 15.7% rally just one month ago. Trading near $111,000 after gaining 2% over 24 hours, BTC faces a critical decision point at resistance levels that have repeatedly capped rallies since mid-October.
The convergence of technical patterns and on-chain accumulation metrics suggests another substantial move may be building, yet one specific price level will determine whether bulls can convert this setup into sustained gains or face another rejection.
Hidden Bullish Divergence Signals Momentum Shift
The Relative Strength Index is displaying a hidden bullish divergence—a pattern that occurs when price forms higher lows while the momentum indicator simultaneously makes lower lows. This configuration typically signals trend continuation rather than reversal, indicating that despite price consolidation, underlying buying pressure is strengthening.
Between June 22 and October 17, Bitcoin established a series of higher lows on the price chart while RSI traced progressively lower lows across the same timeframe. This divergence reveals that each price dip is being met with less aggressive selling than the previous one, suggesting exhaustion among bears and accumulation by patient buyers.
The significance of this pattern becomes evident when examining recent precedent. An identical hidden bullish divergence formed between June 22 and September 25, immediately preceding Bitcoin’s explosive move from approximately $103,500 to $119,700—a 15.7% gain that materialized within days of the pattern’s completion.
If the current setup follows the same trajectory and percentage move, Bitcoin price could target approximately $119,900 from current levels. This projection aligns with technical resistance zones and provides a concrete framework for measuring the pattern’s validity.
Hidden bullish divergences carry particular weight because they appear during uptrends rather than downtrends, suggesting the dominant trend remains intact despite temporary weakness. Unlike regular bullish divergences that signal potential reversals, hidden divergences indicate consolidation within a larger bullish structure—essentially a pause before continuation.
On-Chain Metrics Confirm Large-Scale Accumulation
While technical patterns provide the roadmap, on-chain data reveals the actual behavior of different holder cohorts, and two key metrics strongly support the bullish case emerging from chart analysis.
Net Unrealized Profit/Loss measures the aggregate unrealized gains or losses across all Bitcoin holders, essentially capturing market-wide sentiment through the lens of profitability. When NUPL reaches low levels, holders have minimal paper profits to protect, reducing the psychological incentive to sell and creating conditions where even modest buying pressure can move prices substantially.
As of October 23, NUPL registered 0.48—near its three-month low and a level historically associated with market bottoms or strong support zones. The last time this metric touched similar depths, Bitcoin price rallied 3.8% within days as the absence of profit-taking allowed demand to dominate.
Current readings suggest most holders are either underwater or sitting on minimal gains, creating an environment where capitulation risk is low. Those who’ve held through recent volatility at these valuation levels typically demonstrate higher conviction and longer time horizons.
The Accumulation Trend Score provides complementary insight by tracking how aggressively different wallet size cohorts are adding to or reducing positions. This composite metric considers both participation rates across entity sizes and the magnitude of balance changes over rolling 30-day periods.
Values approaching 1.0 indicate large entities—institutional wallets, whales, and sophisticated funds—are in aggressive accumulation mode. Conversely, readings near zero signal distribution or passive holding without active buying. The metric essentially reveals whether “smart money” is entering or exiting.
Bitcoin’s Accumulation Trend Score has climbed back to 1.0 as of October 23, marking a clear shift from the passive or distributive behavior that characterized early October. This transition confirms that larger holders view current price levels as attractive and are deploying capital accordingly.
The timing is significant: large entities typically accumulate during consolidation phases when retail attention wanes and volatility compresses. Their renewed buying activity suggests these sophisticated participants anticipate the next directional move will be upward.
Why This Confluence Matters
The power of the current setup stems from independent confirmation across multiple analytical frameworks. Technical analysis through RSI divergence, sentiment analysis through NUPL, and behavioral analysis through Accumulation Trend Score all point toward the same conclusion: Bitcoin is building foundations for upside continuation.
When diverse data sources converge on similar narratives, the probability of that outcome materializes increases substantially compared to setups supported by only single indicators. Markets rarely provide such clear alignment, making these convergence moments particularly actionable.
Additionally, the setup isn’t purely retail-driven speculation. The Accumulation Trend Score at 1.0 reveals that entities with the deepest pockets and longest track records are driving current demand—a far more sustainable foundation than retail FOMO that characterized previous cycle peaks.
The $116,500 Inflection Point
Despite bullish signals, Bitcoin faces immediate resistance at $116,500—a level that has rejected every rally attempt since October 11. This price zone represents more than simple technical resistance; it’s become a psychological barrier where sellers consistently emerge to cap upside.
The repeated failures at this level create a “make-or-break” scenario. Each unsuccessful breakout attempt adds sellers at that zone while simultaneously building frustration among bulls, creating a coiled spring effect where eventual resolution tends to be decisive rather than gradual.
A confirmed daily close above $116,500 would accomplish several critical objectives. First, it would validate the hidden bullish divergence pattern, confirming that the technical signal is converting to price action. Second, it would trigger stops and momentum buying from traders waiting for confirmation. Third, it would eliminate overhead supply from previous resistance-turned-support.
The breakout would project initial targets toward $119,700 based on the 15%+ move that similar setups have generated. This level aligns with the RSI-driven rally projection and represents the zone where Bitcoin previously established recent highs. Extended momentum could push toward $125,700 if buying accelerates beyond initial resistance.
Downside Risk Parameters
The bullish case remains contingent on Bitcoin maintaining critical support levels that define the current structure. Support at $110,050 represents the first meaningful defense zone, and sustained trading below this threshold would call into question the hidden divergence pattern’s validity.
A breakdown below $110,050 would likely trigger stops and defensive selling, potentially pushing Bitcoin toward $108,500 where the next support cluster resides. More concerning would be a decline to $106,600, which would invalidate the pattern entirely and suggest the larger structure might be rolling over rather than consolidating.
The risk-reward proposition appears favorable for bulls at current levels. The distance to invalidation around $106,600 represents approximately 4% downside, while the distance to initial breakout targets near $119,700 offers roughly 8% upside—a 2:1 ratio that improves further if extended targets materialize.
Catalysts and Timing Considerations
Several factors could serve as catalysts for the breakout that technical and on-chain indicators suggest is building. Month-end typically brings portfolio rebalancing flows that can create directional momentum. Options expiry events scheduled for coming weeks may reduce hedging pressure that’s capped recent rallies.
Macro factors also loom large. Any signs of institutional buying resumption—whether through ETF inflows or corporate treasury announcements—could provide the spark that converts technical patterns into price action. Conversely, broader market weakness or risk-off sentiment could delay breakout timing.
The hidden bullish divergence pattern doesn’t provide precise timing, only directional bias. Historical precedent shows these setups can take days to weeks to materialize, requiring patience from traders positioning for the move. However, the combination of RSI divergence, NUPL lows, and Accumulation Score at 1.0 suggests the setup is maturing rather than just beginning to form.
What Traders Should Monitor
The next several trading sessions will likely determine whether this setup converts to a substantial rally or requires additional consolidation time. Three specific developments warrant close attention.
First, watch whether Bitcoin can establish trading above $113,000 and hold it as support. This mid-range level represents the first step toward challenging $116,500 resistance and would demonstrate strengthening buyer conviction.
Second, monitor whether Accumulation Trend Score remains at 1.0 or begins declining. Sustained large-holder buying would confirm the narrative that smart money is positioning for upside, while declining scores might indicate accumulation has paused.
Third, observe RSI behavior as price approaches resistance. If momentum can break above 60 on daily timeframes while price challenges $116,500, it would provide additional confirmation that the breakout has legs beyond initial momentum.
For now, Bitcoin price sits at a critical juncture where historical patterns, technical signals, and on-chain behavior all suggest upside potential, yet immediate resistance at $116,500 represents the final hurdle before that potential can materialize into sustained gains. The next week will reveal whether bulls can finally clear this barrier or whether another consolidation phase is required before the projected rally unfolds.
Missed buying crypto at the market bottom?
No worries, there's a chance to win in crypto casinos! Practice for free and win cryptocurrency in recommended casinos! Our website wheretospin.com offers not only the best casino reviews but also the opportunity to win big amounts in exciting games.
Join now and start your journey to financial freedom with WhereToSpin!
Middle East
wheretospininkuwait.com provides a comprehensive selection of trusted online casino reviews for the Middle East أفضل كازينو على الإنترنت. The platform features well-established casinos supporting crypto deposits in the region, including Dream Bet, Haz Casino, Emirbet, YYY Casino, and Casinia.
South Africa and New Zealand
In the South African online casino market, wheretospin.co.za highlights top-rated platforms and online casinos such as True Fortune Casino and DuckyLuck. Meanwhile, for New Zealand players, wheretospin.nz showcases highly recommended casinos, including Casinia, Rooster.bet, and Joo Casino.