In Brief
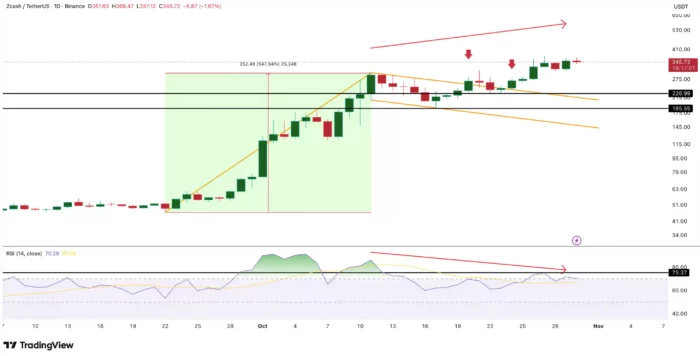
Zcash price surged nearly 400% in October and 44.2% this week, yet RSI bearish divergence signals fading momentum as price makes higher highs while indicator makes lower lows.
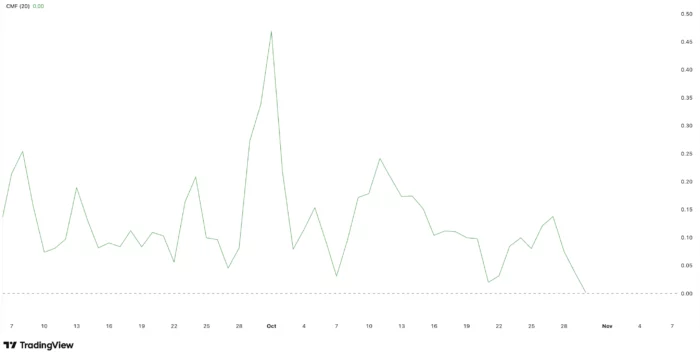
Chaikin Money Flow indicator trending toward zero suggests whale profit-taking rather than continued accumulation, removing key support for sustained rally.
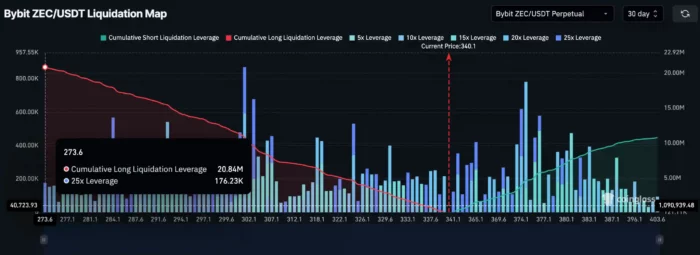
Over $20.8 million in long leverage on Bybit alone creates liquidation cascade risk, with major clusters between $308-$295 threatening pullback amplification.
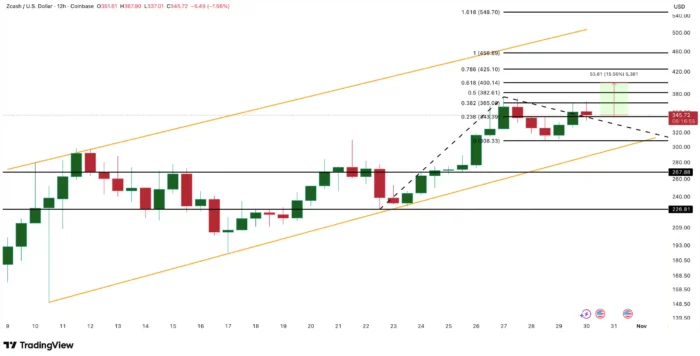
Ascending channel structure remains technically valid with $308 critical support level, breakdown below which would trigger move toward $267 or $226.
Breakout above $365 resistance could project targets toward $382-$400 initially, with extended upside to $456-$548 if momentum indicators confirm price strength.
Zcash price is displaying classic exhaustion characteristics after delivering a spectacular 400% gain through October, with technical indicators diverging from continued price strength in patterns that historically precede corrections or consolidation phases. Trading with a 44.2% weekly gain and 6.6% single-day advance, ZEC maintains impressive buying pressure yet momentum measurements reveal underlying weakness that contradicts surface-level strength.
The tension between continued price appreciation and deteriorating momentum indicators creates a high-stakes setup where Zcash must either validate its rally through indicator confirmation or face correction that realigns price with weakening underlying dynamics.
RSI Bearish Divergence Signals Momentum Disconnect
Between October 11 and October 29, Zcash established a clear bearish divergence pattern where price action and momentum indicator moved in opposite directions. While ZEC made progressively higher highs—the definition of an uptrend—the Relative Strength Index simultaneously formed lower highs across the same timeframe.
This divergence type carries specific implications. RSI measures the magnitude and velocity of price movements to assess whether buying or selling pressure dominates. When RSI declines while prices rise, it indicates each successive price high requires less momentum to achieve—essentially showing the rally is running on diminishing fuel rather than accelerating.
The pattern suggests exhaustion rather than strength. Bulls are pushing prices higher, but with progressively less conviction and force with each attempt. This weakening momentum typically precedes either consolidation where price stalls to allow indicators to catch up, or correction where price retreats to levels where momentum indicators suggest value exists.
Importantly, bearish divergences on daily timeframes often signal trend reversals rather than mere pauses. However, Zcash’s exceptional near-term strength—delivering 400% gains in a single month—may limit correction depth even when divergence resolves. Markets experiencing parabolic moves sometimes sustain momentum longer than technical indicators suggest is rational, particularly when driven by fundamental catalysts or narrative strength.
For the divergence concern to dissipate, RSI would need to break above 75 while price simultaneously advances. This synchronization would indicate momentum is re-accelerating to match price gains, validating the rally’s continuation rather than suggesting exhaustion. Until such confirmation occurs, the divergence remains a prominent warning signal.
Whale Money Flow Indicator Reveals Profit-Taking
The Chaikin Money Flow indicator—which specifically tracks accumulation and distribution patterns among large holders—has trended downward through recent sessions and now hovers near zero. This threshold carries particular significance because it marks the transition point between net accumulation (positive values) and net distribution (negative values).
CMF’s decline toward neutral suggests whale participants who fueled Zcash’s rally are shifting from accumulation mode to profit-taking. Large holders appear to be booking gains from the 400% move rather than adding positions in anticipation of further upside. This behavioral shift removes a critical support pillar for sustained rallies.
When retail traders push prices higher while whales distribute, the resulting dynamic typically proves unsustainable. Retail capital alone rarely possesses sufficient depth to support continued appreciation once larger holders begin exiting. The whales who accumulated at lower levels and drove initial momentum now appear satisfied with gains and are rotating capital elsewhere.
The near-zero CMF reading doesn’t yet indicate aggressive selling—that would require substantially negative values. Instead, it signals neutrality where inflows and outflows roughly balance. However, the trajectory matters as much as the level. CMF declining from positive territory toward zero shows the trend is toward distribution rather than continued accumulation.
For bullish momentum to resume convincingly, CMF would need to reverse higher, indicating renewed large-holder accumulation. Without this confirmation, price gains would depend entirely on retail enthusiasm—a foundation that historically proves fragile during volatility or negative catalysts.
Extreme Long Leverage Creates Liquidation Cascade Risk
Derivatives positioning data from Bybit reveals heavily skewed leverage favoring long positions, with over $20.8 million stacked on the buy side against only $10.7 million in shorts. This 2:1 ratio indicates traders remain overwhelmingly bullish and positioned for further upside despite momentum warning signals.
Such positioning creates what’s known as long squeeze risk—scenarios where modest price declines trigger cascading liquidations that amplify downward moves. When overleveraged longs face margin calls, their forced position closures generate selling pressure that pushes prices lower, triggering additional margin calls in a self-reinforcing cycle.
The liquidation map identifies major clustering between $308 and $295, indicating these price levels contain particularly high concentrations of long positions vulnerable to forced closure. If Zcash declines into this zone, the resulting liquidation wave could accelerate selling pressure substantially beyond what normal spot market dynamics would produce.
Zcash’s historical volatility amplifies liquidation risks. The token has demonstrated capacity for rapid price swings that can trigger cascading liquidations before traders react. Even seemingly modest 5-10% corrections can snowball into 15-20% declines when liquidation cascades activate, particularly in assets with concentrated leverage positioning.
The extreme long bias also reveals another risk factor: positioning already reflects bullish conviction. If most participants who would buy have already established positions, the marginal buyer pool shrinks. New capital inflows would be required to push prices substantially higher, yet the leveraged positioning suggests existing capital is already fully deployed.
For leverage positioning to normalize without triggering cascades, either prices must continue rising to move liquidation thresholds lower, or long traders must voluntarily reduce exposure through deleveraging. The former requires sustained buying pressure that momentum indicators suggest may not materialize, while the latter could itself generate selling pressure as positions unwind.
Ascending Channel Maintains Bullish Structure
Despite warning signals from momentum indicators and leverage positioning, Zcash’s chart structure remains technically bullish through the ascending channel pattern evident on 12-hour timeframes. This pattern—characterized by parallel upward-sloping trendlines—typically resolves with continuation in the established direction rather than reversal.
The channel’s upper trendline currently sits near $365, representing the immediate resistance level that has rejected multiple advance attempts since October 27. However, this trendline remains relatively weak with only two touchpoints defining its slope, meaning a breakout above it wouldn’t necessarily invalidate the pattern but might simply require redrawing to accommodate new price action.
A decisive close above $365 would confirm breakout momentum and project initial targets toward $382 based on recent consolidation ranges. Beyond this level, the psychologically significant $400 threshold represents the next major resistance where profit-taking typically concentrates. Round numbers attract disproportionate attention from traders who place orders at these levels, creating natural supply zones.
Extended upside following a clean $400 break could target $456 and potentially $548 based on Fibonacci extension measurements from the pattern’s origination point. These levels represent 14% and 37% gains respectively from the $400 threshold, providing concrete targets if momentum accelerates beyond current consolidation.
Critical Support at $308 Defines Bullish Invalidation
The lower boundary of the ascending channel coincides with $308—the price level that has provided consistent support through recent consolidation and represents the pattern’s invalidation threshold. Sustained trading below this level would break the bullish channel structure and suggest the rally has exhausted rather than merely pausing.
A breakdown below $308 would likely trigger the liquidation cascade risk discussed earlier, as this level aligns closely with major long position clustering. The resulting forced selling could accelerate declines toward $267—roughly 13% below the invalidation level—where the next significant support zone resides based on previous consolidation areas.
Further deterioration below $267 would open the path toward $226, representing approximately 35% downside from current levels. While this scenario would require substantial breakdown of current structure, the combination of momentum divergence, fading whale support, and extreme leverage positioning creates plausible pathway for such correction if selling pressure intensifies.
The $308 level functions as line of demarcation separating scenarios where current weakness represents healthy consolidation within an ongoing uptrend versus recognition that the 400% rally has fully exhausted and requires substantial correction before continuation becomes viable.
Volatility Likely to Spike Regardless of Direction
The combination of technical divergences, extreme positioning, and defined breakout/breakdown levels creates conditions where volatility expansion appears likely regardless of which direction ultimately prevails. Markets compressed near decision points with conflicting signals typically resolve explosively once direction clarifies.
If bulls can drive ZEC above $365 and validate the move with improving momentum indicators, the resulting breakout could generate rapid appreciation toward $400+ as shorts cover and momentum traders establish positions. The heavily skewed long positioning would amplify this move as traders add to winning positions.
Conversely, if bears push prices below $308, the liquidation cascade mechanism would likely accelerate declines as forced selling creates downward momentum that attracts additional short-term sellers. The speed of modern derivatives markets means such moves can unfold within hours rather than days, creating whipsaw conditions challenging for position management.
For traders, the setup demands clear risk parameters and position sizing appropriate for expanded volatility. Stop losses should account for potential volatility spikes rather than normal trading ranges, while profit targets should recognize that moves could extend substantially beyond initial projections once direction becomes clear.
Fundamental Catalysts Remain Unclear
Notably absent from the technical setup is clear fundamental catalyst explaining Zcash’s 400% October surge. Privacy coins have experienced renewed interest amid regulatory discussions and surveillance concerns, potentially providing thematic tailwind. However, the magnitude of ZEC’s rally substantially exceeds moves in comparable privacy-focused tokens, suggesting factors beyond sector-wide enthusiasm.
Without clear fundamental drivers, the rally’s sustainability depends more heavily on technical factors and market structure—precisely the elements now showing exhaustion signals. Fundamentally-driven rallies typically demonstrate more resilience during consolidation phases because conviction stems from value assessment rather than momentum chasing.
The absence of obvious catalysts also means unexpected negative developments could trigger disproportionate reactions as participants lacking fundamental conviction exit positions rapidly during uncertainty. Technically-driven rallies often reverse as quickly as they developed once momentum shifts.
What Traders Should Monitor
Several specific developments over coming sessions will determine whether exhaustion signals convert to actual correction or whether Zcash can extend its remarkable run despite momentum concerns.
First, watch whether RSI can break above 75 while price advances. This synchronization would indicate momentum is re-accelerating and would substantially reduce divergence concerns. Continued RSI weakness as price attempts new highs would reinforce exhaustion thesis.
Second, monitor CMF for any reversal higher from current near-zero levels. Renewed positive readings would suggest whales are re-entering accumulation mode rather than continuing profit-taking, providing foundation for sustained gains.
Third, observe how price behaves at $365 resistance and $308 support. Clean breaks through either level with strong volume would provide directional clarity, while continued consolidation between these boundaries would extend current uncertainty.
Fourth, track leverage positioning changes. Deleveraging on the long side would reduce cascade risk and potentially stabilize price action, while further leverage expansion would amplify vulnerability to sharp moves.
For now, Zcash price remains in a precarious position where impressive surface strength masks underlying deterioration in momentum and positioning metrics that historically precede corrections. Whether the 400% rally has more room to run or faces imminent pullback will likely clarify within days as technical signals converge toward resolution.