In Brief
Ethereum exchange balances declined by 1.36 million ETH (approximately $4 billion at current prices) within one week as holders accumulated positions below the $3,000 psychological threshold rather than panic selling into weakness.
The first Death Cross formation in nine months appeared on Ethereum’s price chart this week, ending the Golden Cross structure that supported the summer rally and historically signaling consolidation or renewed downside pressure in prior cycles.
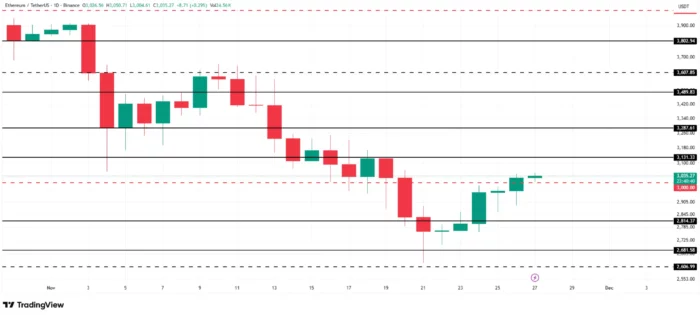
ETH currently trades at $3,035, attempting to reclaim $3,000 as support rather than resistance—a flip that would invalidate near-term bearish structure and open paths toward $3,131 and $3,287 if successful.
Historical Death Cross patterns on Ethereum have preceded periods of sideways consolidation followed by eventual downside continuation, though the magnitude of concurrent accumulation creates uncertainty about whether this cycle follows historical precedent.
Critical support levels exist at $2,814 and $2,681—losing these would confirm bearish structure and potentially expose $2,606, invalidating the accumulation thesis that $3,000 represents a local bottom.

Ethereum has formed its first Death Cross in nine months as the altcoin trades below the critical $3,000 psychological level, creating a technical structure that historically precedes consolidation or renewed declines. However, simultaneous exchange outflows totaling approximately $4 billion suggest that holders are accumulating into weakness rather than capitulating—a behavior pattern that contradicts typical Death Cross dynamics. The convergence of bearish technical signals and bullish on-chain accumulation creates uncertainty about whether Ethereum will follow historical Death Cross patterns or establish a new precedent where aggressive buying overwhelms deteriorating momentum indicators. Understanding whether $4 billion in accumulation can counteract the first major bearish technical signal since July requires examining what Death Cross formations historically mean for Ethereum, how exchange outflow timing and magnitude compare to prior cycles, and which price levels must hold or break to validate either the bullish accumulation thesis or bearish momentum continuation.
Exchange Outflows Total $4 Billion as Holders Accumulate Below $3,000
Ethereum exchange balances have declined dramatically over the past week, with supply on trading platforms falling from 2.77 million ETH to 1.41 million ETH—a reduction of 1.36 million ETH. At Ethereum’s current price near $3,000, this represents approximately $4 billion in capital that moved from exchanges into self-custody wallets or cold storage.
The timing and magnitude of these outflows matter significantly. The withdrawals accelerated precisely as Ethereum broke below the $3,000 psychological level—a price point that has functioned as major support and resistance throughout 2024. Rather than triggering panic selling, the breakdown below $3,000 appears to have catalyzed accumulation by investors who view current prices as representing value relative to recent trading ranges.
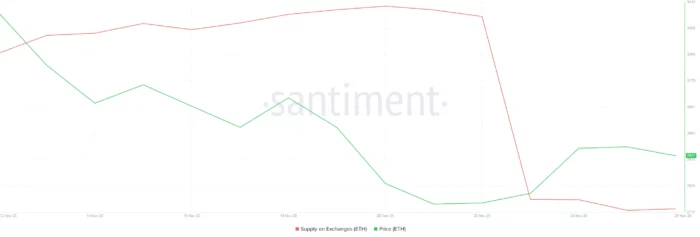
Exchange outflows can signal different market dynamics depending on context. During panic phases, exchange outflows sometimes represent investors moving assets to cold storage to avoid forced liquidations or exchange risk. However, the pace and coordination of this particular outflow—concentrated within one week and coinciding with price weakness rather than cascading liquidation—suggests intentional accumulation rather than defensive repositioning.
The behavior reveals that a substantial cohort of Ethereum holders interprets the break below $3,000 as a temporary dislocation rather than the beginning of sustained downtrend. These holders are positioning for recovery rather than protecting against further losses. Whether this positioning proves prescient or premature depends entirely on whether Ethereum can reclaim $3,000 as support and invalidate the emerging bearish technical structure.
Death Cross Formation Ends Nine-Month Golden Cross Structure
Ethereum’s exponential moving averages formed a Death Cross this week—the first such formation in more than nine months. A Death Cross occurs when a short-term moving average (typically the 50-day) crosses below a long-term moving average (typically the 200-day), signaling that recent price momentum has weakened relative to longer-term trends.
This Death Cross ends the Golden Cross structure that formed in July and supported Ethereum’s summer rally. Golden Cross formations—where short-term averages cross above long-term averages—typically signal strengthening momentum and often precede sustained uptrends. The reversal of that structure through Death Cross formation suggests the momentum that drove Ethereum’s summer strength has dissipated.

Historical analysis of Ethereum Death Cross formations reveals consistent patterns: these technical signals have preceded periods of short-term consolidation, occasional minor relief rallies, followed by renewed declines. The pattern doesn’t guarantee immediate collapse but does increase probability that Ethereum will trade sideways or test lower support levels before establishing a sustainable bottom.
The significance of this being Ethereum’s first Death Cross in nine months cannot be understated. The extended period without this bearish signal meant Ethereum operated in a technically bullish regime throughout most of 2024. The regime change represented by Death Cross formation fundamentally alters the technical landscape—resistance levels become harder to break, support levels become more vulnerable, and momentum-based trading strategies shift from bullish to neutral or bearish bias.
Critical $3,000 Level Determines Whether Accumulation Overcomes Technical Weakness
Ethereum currently trades at $3,035, positioning just above the $3,000 psychological level that has functioned as the pivotal support-resistance boundary throughout November. The asset is attempting to flip $3,000 from resistance back into support—a reversal that would invalidate the near-term bearish structure and potentially trigger short-covering from traders positioned for further downside.
The $4 billion in exchange outflows occurred primarily as Ethereum traded below $3,000, suggesting accumulation concentrated in the $2,900-$3,000 range. These buyers are now testing whether their positioning was premature or well-timed. A decisive reclaim of $3,000—characterized by sustained daily closes above this level rather than brief intraday spikes—would validate the accumulation thesis and potentially unlock moves toward higher resistance levels.
If Ethereum successfully reclaims $3,000 as support, the technical structure opens paths toward $3,131 initially and $3,287 subsequently. These levels represent prior resistance zones where supply previously overwhelmed demand. Breaking these levels would require not just the $4 billion in recent accumulation but also momentum-based buying from traders who observe technical confirmation and position accordingly.
The bullish scenario depends on several conditions aligning: macroeconomic stability allowing risk assets to recover, Bitcoin maintaining support levels that prevent sector-wide selling, and Ethereum-specific catalysts (such as protocol upgrades or institutional adoption developments) reinforcing positive sentiment. Without these supporting factors, $3,000 may prove to be temporary resistance that Ethereum cannot sustain above.
Downside Scenario: Support Levels That Must Hold to Maintain Bullish Structure
The bearish alternative—where Death Cross momentum overwhelms accumulation—would manifest through Ethereum failing to reclaim $3,000 and subsequently testing lower support structures. The critical support levels that would determine downside magnitude exist at $2,814 and $2,681.
$2,814 represents the first major support if Ethereum loses $3,000 decisively. This level has functioned as support during prior November corrections and represents approximately 7% downside from current prices. Holding this level would suggest accumulation continues at lower prices and that the overall bullish structure remains intact despite technical weakness.
$2,681 represents the critical support that separates consolidation from breakdown. Losing this level—approximately 12% below current prices—would invalidate the bullish thesis that recent accumulation represents bottom-fishing. It would suggest that the $4 billion in exchange outflows occurred prematurely and that holders who accumulated near $3,000 are now underwater on their positions.
If Ethereum breaks below $2,681, the next significant support sits at $2,606, with potential for further decline toward $2,400-$2,500 range if selling accelerates. This scenario would confirm that Death Cross momentum has overcome accumulation and that Ethereum has entered a deeper correction phase requiring months rather than weeks to resolve.
Historical Context: How Prior Death Cross Formations Resolved
Examining Ethereum’s historical response to Death Cross formations provides context for potential outcomes. Prior Death Cross events have typically preceded consolidation periods lasting 4-8 weeks, during which Ethereum traded sideways or tested lower support levels before eventually either resuming uptrends (if broader market conditions improved) or confirming downtrends (if conditions deteriorated).
The most recent Death Cross prior to this week occurred in early 2024, preceding a consolidation phase where Ethereum traded in a bounded range before Bitcoin’s strength eventually pulled the broader market higher. That resolution took approximately six weeks and required external catalyst (Bitcoin ETF approvals creating sector-wide momentum) rather than Ethereum-specific strength.
However, the current cycle features a variable that didn’t exist in prior Death Cross episodes: $4 billion in concentrated accumulation occurring simultaneously with the technical signal formation. This unprecedented accumulation-amid-Death-Cross dynamic creates uncertainty about whether historical patterns remain predictive.
If accumulation overwhelms technical momentum, this cycle could establish a new precedent where aggressive buying at perceived value levels invalidates bearish technical signals faster than historical averages. Conversely, if technical momentum overwhelms accumulation, it would suggest that even massive capital inflows cannot counteract deteriorating momentum structures—reinforcing the importance of technical analysis over on-chain metrics.
Macro Context and Ethereum-Specific Catalysts That Will Influence Resolution
The resolution of Ethereum’s Death Cross and the effectiveness of $4 billion in accumulation depend substantially on factors external to Ethereum’s isolated technical structure.
Macroeconomic conditions will shape whether risk assets broadly can recover or face continued pressure. If Federal Reserve policy signals remain hawkish or economic data deteriorates, risk assets including cryptocurrencies typically underperform regardless of asset-specific accumulation. Conversely, if macro conditions stabilize, Ethereum accumulation positions holders for outsized gains.
Bitcoin’s direction matters disproportionately because Bitcoin remains the dominant factor driving cryptocurrency sector sentiment. If Bitcoin establishes support and resumes upward momentum, Ethereum typically follows with amplified moves. If Bitcoin tests lower levels, Ethereum usually underperforms, making isolated Ethereum analysis insufficient.
Ethereum-specific catalysts could provide the narrative support needed for accumulation to translate into price recovery. Potential catalysts include major protocol upgrades, institutional adoption announcements, or regulatory clarity that specifically benefits Ethereum’s positioning. Without these catalysts, Ethereum remains dependent on broader sector momentum.
Forward Outlook: Binary Outcome Determined by $3,000 Level
Ethereum faces a binary near-term outcome determined primarily by whether the asset can reclaim and hold $3,000 as support. The $4 billion in exchange outflows suggests substantial capital believes current prices represent value, but belief alone doesn’t guarantee successful technical reversal.
Bullish scenario activation requires: Sustained daily closes above $3,000, followed by breaks above $3,131 and $3,287 that confirm momentum reversal. This scenario would invalidate Death Cross bearishness and potentially trigger short-covering that amplifies upside.
Bearish scenario activation requires: Failure to reclaim $3,000, followed by breaks below $2,814 and $2,681 that confirm Death Cross momentum. This scenario would suggest accumulation occurred prematurely and that further downside remains likely.
The next 7-14 days will likely determine which scenario activates. Monitoring exchange flows during this period matters significantly—if outflows continue even as prices test lower levels, it reinforces that conviction remains strong. If outflows reverse into inflows (ETH returning to exchanges), it signals that accumulation has exhausted and distribution may begin.
For now, Ethereum exists in a technical regime where bearish momentum signals (Death Cross) directly contradict bullish on-chain behavior ($4 billion accumulation). One of these signals will prove dominant. Historical precedent suggests technical momentum typically prevails, but the magnitude of concurrent accumulation creates genuine uncertainty about whether this cycle follows historical patterns or establishes new precedent.